The links below list additional charts that have been developed to date including decimal/ fraction equivalency, percentage, number grids, and place value charts.
Check out the Customizable Hundreds Number Chart. You can set the start number and the interval, change the number of rows, have negative numbers, decimals, and you can start the numbers from the bottom or the top.
This is an example of a customizable math resource that lets you change the values to make the charts and tables just the way you need them.
We want to do a lot more of this type of user-controlled resource so please contact us to request such a customizable chart and we’ll try to add it for you as quickly as we can.
Place Value Charts
- Place Value Chart: Tens – with blocks for highlighting
- Place Value Chart: Hundreds – with blocks for highlighting
- Place Value Chart: Tens
- Place Value Chart: Hundreds
- Place Value Chart: Thousands
- Place Value Chart: Hundred Thousands
- Place Value Chart: To Billions
- Place Value Chart: Thousandths To Billions
- Place Value Chart: To Quadrillions
- Decimal Chart – tenths, hundredths, thousandths
For Wall Mounting

- Thousandths to Millions – 22 pages, landscape format
- Thousandths to Millions – 22 pages, portrait format
- Thousandths to Millions – 17 pages, A5-sized
The wall mounting charts include matching numerals 0 to 9 for display below the headers if required.
More Place Value Charts
- Ones and Tens – 16 per page | 4 per page | 1 per page
- Ones, Tens, & Hundreds – 16 per page | 4 per page | 1 per page
- Ones, Tens, Hundreds, & Thousands – 16 per page | 4 per page | 1 per page
- Tenths and Hundredths – 1 per page
- Tens, Ones, Tenths, and Hundredths – 1 per page
- 1000s, 100s, 10s, 1s, Tenths and Hundredths – 1 per page
- Tenths, Hundredths, & Thousandths – 1 per page
The place value arrow cards, available in small, medium, and large formats are also a good way to practice.
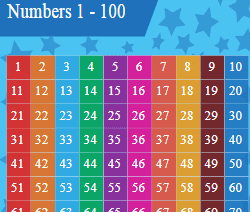
Number Grid/ Chart
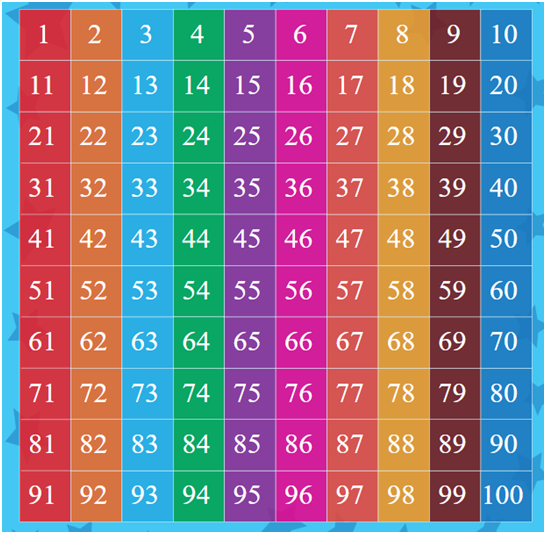
We used to have seven different number charts but now we only have one! Worry not though as the one that is left has all the features of the other six, all rolled into one. The standard grid is 10 x 10 with numbers starting at 1 although this can be widely customized. The start number, the interval, the number of rows, the number of columns, the range of numbers, and the font-size can all be changed. There are also a couple of handy features – starting the numbers from the bottom-up (helpful for some early-stage students when developing number sense) and the option to skip values at the start of each row which allows large-scale grids to be pasted together in a tile-like manner.
- Numbers Chart – From 10 to 9999 Numbers – (lots of customization options)
- Number Squares – in color – (2 variations – pictured right/ below)
If you are looking for a smaller format, the 4-per-page option below might be of interest.
- Numbers Chart 1 to 120 – (pocket-size, 4 per page)
Ten Frames
This 17-page resource with printable ten frames provides a variety of different sizes and formats all of which can be used to help your children develop their number sense. It will help, in particular, with number bonds to ten.
Domino Cards
There are many games and activities involving dominoes that can help students develop number sense. Just one example is playing “snap” where, for example, the first to shout “snap” when turning over a 1 + 6 domino after a 3 + 4 domino gets the cards.
The two documents below can be printed out (ideally onto card) and cut into individual dominoes. Note: Many students will benefit from making their own domino cards by using the blanks and adding their own dots.
- Printable Domino Cards– 28 dominoes on 2 pages
- Blank Domino Cards– Make Your Own Dots! (by click or by hand)
Fraction Dominoes
The 4 sets of dominoes below each have 20 dominoes. The first set are for practicing identifying fractions, the second and third sets are on equivalent fractions, and the fourth set cover equivalency of fractions, decimals, and percentages.
- Fraction Domino Cards– matching words, fractions, and images.
- Equivalent Fraction Cards #1 – matching equivalent fractions. e.g. 4/10 = 2/5
- Equivalent Fraction Cards #2 – matching equivalent fractions. e.g. 6/15 = 2/5 (slightly harder)
- Fractions, Decimals, & Percentages Cards– e.g. 75% = 0.75 = 3/4
Time Dominoes
The two sets of printable cards below show dominoes for practice with telling time to the hour and half-hour and for telling time to the nearest minute. Both include two pages of cards with blank clock faces for students to make their own time dominoes; this is a great “hands-on” activity which will help many children to develop their sense of time.
- Time Domino Cards #1 – to the hour and half-hour
- Time Domino Cards #2 – to nearest minute
List of other math charts and printables
- Multiplication and Division Fact Families – (1 of 2)
- Multiplication and Division Fact Families – (2 of 2)
- List of Prime Numbers – (up to 251)
- Number Square to 100 Showing Prime Numbers
- Number in Words Chart – Enter values and display numbers in word form
- Squares and Square Roots Chart – 0 to 100
- Customizable Pre-Algebra T-Chart – You enter the values!
- Decimal/ Fractions Equivalents Chart e.g. fractions to 1/64
- Customizable Percentage Chart – You enter the values!
- Blank Printable Thermometers
- Printable Graph Paper Generator
- Printable Blank Grids – at centimeter, inch, & quarter inch intervals
Printing the documents
The charts are formatted for printing on one sheet of paper. Click the links above and select the Print Chart option to print the charts you want.
Note: You will find printable multiplication tables here.
Note: The Decimal/ Fractions Equivalents Chart is also included in the By Subject section under Fraction Worksheets and Charts.
What is Place Value?
Place value is the basis of our entire number system. This is the system in which the position of a digit in a number determines its value. The place value of a digit in a number is the value it holds to be at the place in the number. Therefore, the number 65,471 is different from 17,645 because the digits are in different positions.
What is a Place Value Chart?
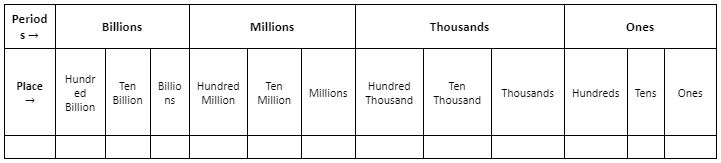
A place-value chart is a way to make sure digits are in the correct places. The place value chart of numbers is followed by most of the countries around the world. In this system, a number is split up into groups or periods. The following are the features of the International System of Numeration –
- We start from the extreme right digit of the number to form the groups.
- The groups are called ones, thousands, millions and billions.
- The ones, in turn, split up into hundreds, tens and units. The first three digits on the extreme right form a group of ones which in turn split into hundreds, tens and units.
- The second group of the next three digits on the left of the group of ones form the group of thousands which is further split into thousands, ten thousand and hundred thousand.
- The third group of the next three digits on the left of the group of thousands form the group of millions which is split into millions, ten million and hundred million.
- Three digits on the left of the group of millions form a group of billions which is split into billion, ten billion and hundred billion.
The place value chart of numbers is represented as –
From the place value system, we can say that
1 Million = 1000 thousand
1 Billion = 1000 Million
How to Read a Number using the Place Value Chart?
To read numbers according to their place value, we first separate groups, also known as periods of ones, thousands, millions and billions by commas. Then we read the number from the right most period. The digits in the same period are read together and the name of the period, except units, is read along with them. for example, the number 75843125 is written as 75, 843, 125 and it is read as “Seventy-five million eight hundred forty-three thousand one hundred and twenty five”.
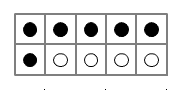
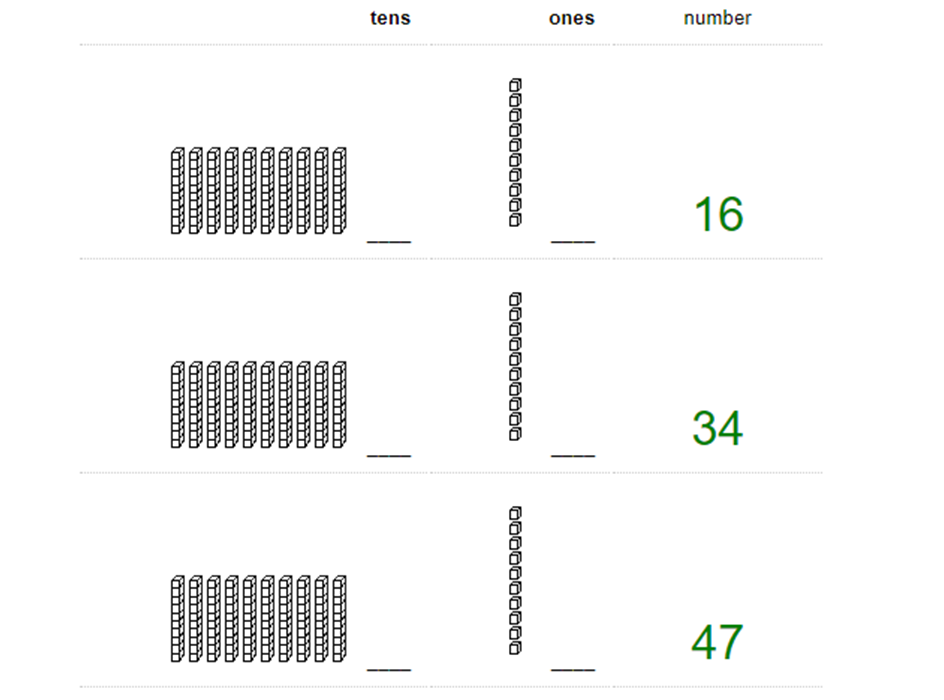
We have prepared specific place value charts that will help the child understand how to read a number according to its place. An example of how our block charts look like is given below –
Place Value Charts of Decimal Numbers
We know that each place in the place value table has a value ten times the value of the next place on its right. In other words, the value of a place is one-tenth of the value of the next place on its left. We observe that if one digit moves one place left to right its value becomes one-tenth ( $\frac{1}{10}$ ) of its previous value and when it moves two places left to right its value comes one-hundredth ( $\frac{1}{100}$ ) of its previous term and so on. Therefore, if we wish to move beyond ones place which is the case of decimals, we will have to extend the place value table by introducing the places of tenths ( $\frac{1}{10}$ ), hundredths ( $\frac{1}{100}$ ), thousandths ( $\frac{1}{1000}$ ) and so on.
Therefore, the place value table in case of a decimal number will be of the form –
| Thousands ( 1000 ) | Hundreds ( 100 ) | Tens ( 10 ) | Ones ( 1 ) | Tenths ( 1/10 ) | Hundredths ( 1/100 ) | Thousandths ( 1/1000 ) |
In order to read decimals, the following steps are used –
- Read the whole number part
- Read the decimal point as point
- Read the number to the right of the decimal point. For example, 14.35 will be read as Fourteen point three five. Alternatively, the number to the right of the decimal point can also be read by reading the number to the right of the decimal point and naming the place value of the last digit. For instance, the number 8.527 can also be read as eight and five hundred twenty seven thousandths.
We have prepared specific place value charts that will help the child understand how to read a decimal number according to its place. An example of how our block charts look like is given below –
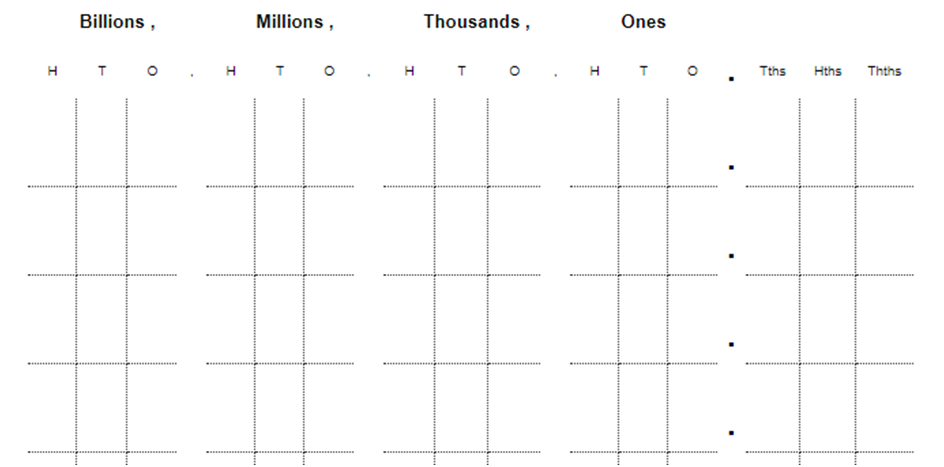
Note that the above chart can be used to represent small numbers containing thousandth or hundredth to very large numbers that run in millions and billions. So, any type of number you think of, we have a chart available for you to understand the placement of its numbers according to the place value.
Why are Place Value charts Important?
The place value chart is not just a visual representation for beginners. It is a chart that helps understand the composition of numbers from smaller to larger and from whole numbers to decimal numbers. Some of the reasons why place value is so important are –
- A place value chart helps understand the formation of large numbers.
- It is not essential for the understanding of numbers only, it helps in making the child understand how various operations are performed between operations such as addition, subtraction, multiplication and division.
- It is how we can compare numbers; line up numbers vertically; make sense of addition, subtraction, multiplication, and division with larger numbers; and is the foundation for regrouping.
- It helps in understanding the digit furthest to the left has the greatest place value and the manner in which numbers are composed.
Not just the place value charts, we have prepared for you a number of other charts as well such as the Number and Grid Chart
What is a Number and Grid Chart?
A number and grid chart is a standard grid is 10 x 10 with numbers starting at 1. This chart can be customised according to your needs. You have the option to change the start number, the interval, the number of rows, the number of columns, the range of numbers, as well as the font size of the number grid. Below is an example of the number grid that is available to you for customisation –
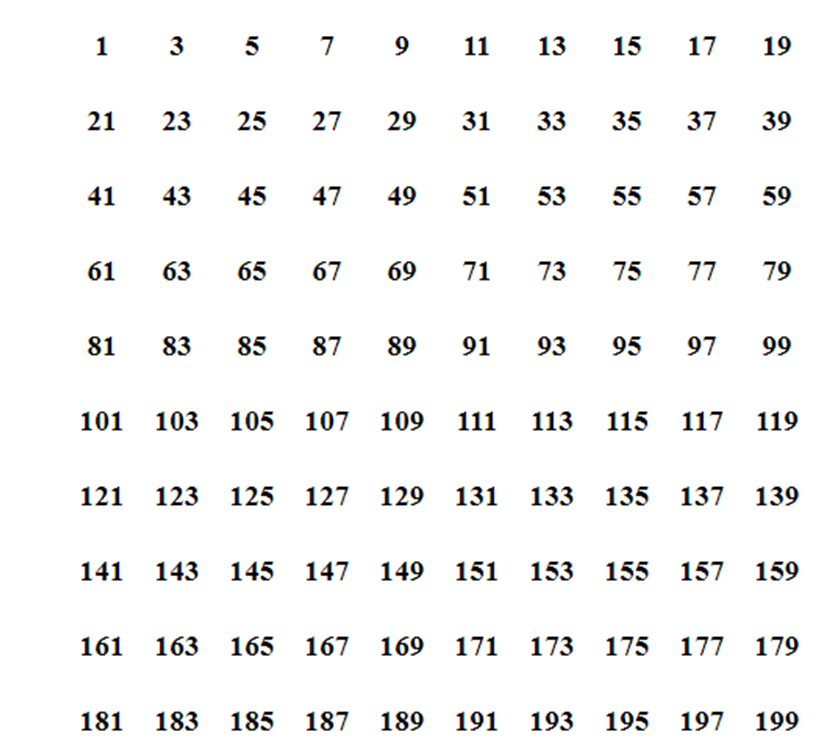
Suppose you want to print a chart of all odd numbers between 1 to 200, you just need to customise the chart and you will have –
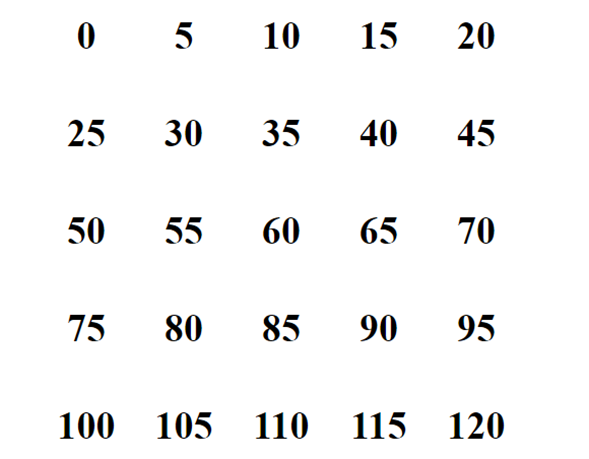
Using the same chart you can also prepare multiples of a number such as the multiples of 5 chart shown below which has been prepared after customising the above chart –