Your children may have already encountered bar and picture graphs in 2nd grade. In 3rd grade they create and read scaled versions of these types of graph where quantities are represented using a different scale. For bar graphs this means the intervals are greater than one and, for picture graphs, the symbol or picture also represents more than one (usually 2, 5, 10, or other appropriate scale).
Your children will also be expected to interpret information on bar and picture graphs and, in doing so, solve both one and two-step problems.
Collecting and sorting data
Your children will likely have used tally marks already in 1st and 2nd grade but you should check to ensure they understand their use. Similarly, check that they understand what charts and tables are and how they are used.
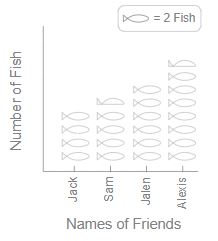
Jack, Sam, Jalen, and Alexis went on a fishing trip. The chart below shows how many fish each caught. Highlight to your children how the tally marks are used and tell or remind them that the data is counted in groups of five.
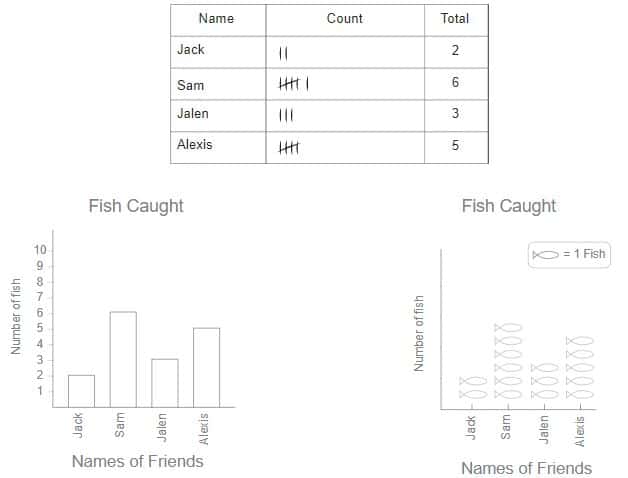
Have your children work through this 2-step worksheet which starts with the charting and graphing of sample data before challenging your children to create their own chart by counting and recording data from their own survey. If you and your children can do your own survey, they will enjoy and benefit more from the exercise.
Download the Representing Data using Table and Charts Worksheets
Looking for the best way to teach students about Representing Data using Table and Charts?
This premium worksheet bundle contains 10 activities to challenge your students and help them understand Representing Data using Table and Charts.
View the Worksheets
Survey Ideas/ Prompts
Look out the window for 5 minutes and count vehicle types or colors. Survey the kitchen cupboards. Which item of clothing do you have most of? Check the channels on your TV – how types of channel? e.g. sports, news etc.
Interpreting Bar and Picture Graphs
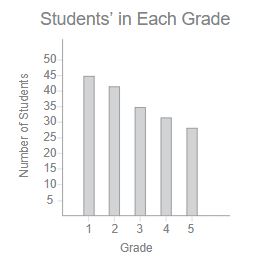
Your children should be able to make observations from bar and picture graphs. For example, from the graph above showing how the students in a class travelled to school, they should be able to answer questions like “how many students are in the class?” or “how many more came in a car than cycled?”
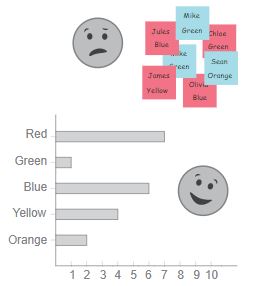
As your children work through this activity worksheet check that they understand and use the labels and numbers on the chart. Ask “which is the most favorite”, “which is the least favorite”, “how many more (or less) are there that like ..” questions and encourage your children to use the numbers on the chart as opposed to counting and the difference in height of the columns when comparing.
Discuss with your children about data and how, if it is well organized, it is easier to understand and more useful.
Download the Understanding Picture Graph and Bar Graph Worksheets
Looking for the best way to teach students about Understanding Picture Graph and Bar Graph?
This premium worksheet bundle contains 10 activities to challenge your students and help them understand Picture Graph and Bar Graph.
View the Worksheets
Horizontal or Vertical
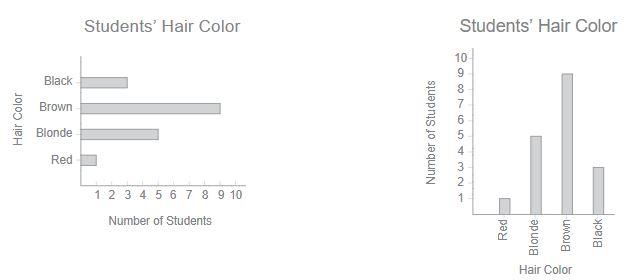
Review the two examples below. If required, help your children to see that the same data is being represented using the horizontal and vertical layouts. Do not assume that they will see this right away.
Scaled Bar and Picture Graphs
Once you children are comfortable creating and reading charts where the vertical axes have intervals of one or where one symbol represents a count of one, they can move on to using different scales to show data more efficiently which is especially useful when larger numbers are involved.
Bar Graph
The two worksheets below provides practice with graphing data using different vertical intervals. This can be a challenging exercise, especially the requirement to select an appropriate interval and range.
Picture Graph
Scaled picture graphs use symbols to represent multiple occurrences with a key showing how many each symbol represents. Interpreting these graphs requires either addition or, more efficiently, multiplication to find the quantities represented by the symbols.
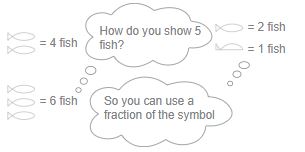
A further challenge is how fractions can be used if required to show and interpret quantities that are not a multiple of number represented by each symbol.
The example below has more fish being caught by the four friends. It uses halve of a symbol to show the exact number.
Have your children try the two worksheets below to practice creating scaled picture graphs.
Solving Problems Using Bar and Picture Graphs
Scaled Bar Graphs
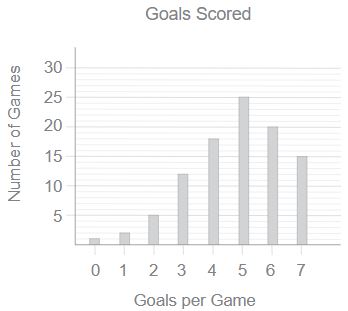
Your children will be expected to interpret data shown on scaled graphs and to solve one and two-step problems in doing so. The example below shows a team’s goals-per-game record over a season. Discuss it with them and ask the same “how many more/ fewer” type questions as you asked with the non-scaled graphs. Ask also about the strategies they use. If they use addition to interpret the data, suggest and encourage the use of multiplication.

Have your children try the two worksheets below to practice solving problems using scaled bar graphs
Scaled Picture Graphs
Remind your children about the scale or how many occurrences one symbol represents on the scaled picture graph and that the scale will change depending on the data. Use the example below, which shows the different types of milkshake sold in one day, to discuss and interpret the graph. Ask the same types of question as with the bar graphs and similarly encourage multiplication as opposed to addition strategies. e.g. if addition is being used ask “is there another way to work out the numbers?”
How many more strawberry milkshakes than chocolate ones were sold?
Have your children try the two worksheets below to practice solving problems using scaled picture graphs