Graph & Charts Math Worksheets
In this section, you can view and download all of our Graph & Charts worksheets. Browse by common-core grade, age or theme and download the editable worksheets instantly.
Graph & Charts Worksheets & Study Resources:
Brief Description:
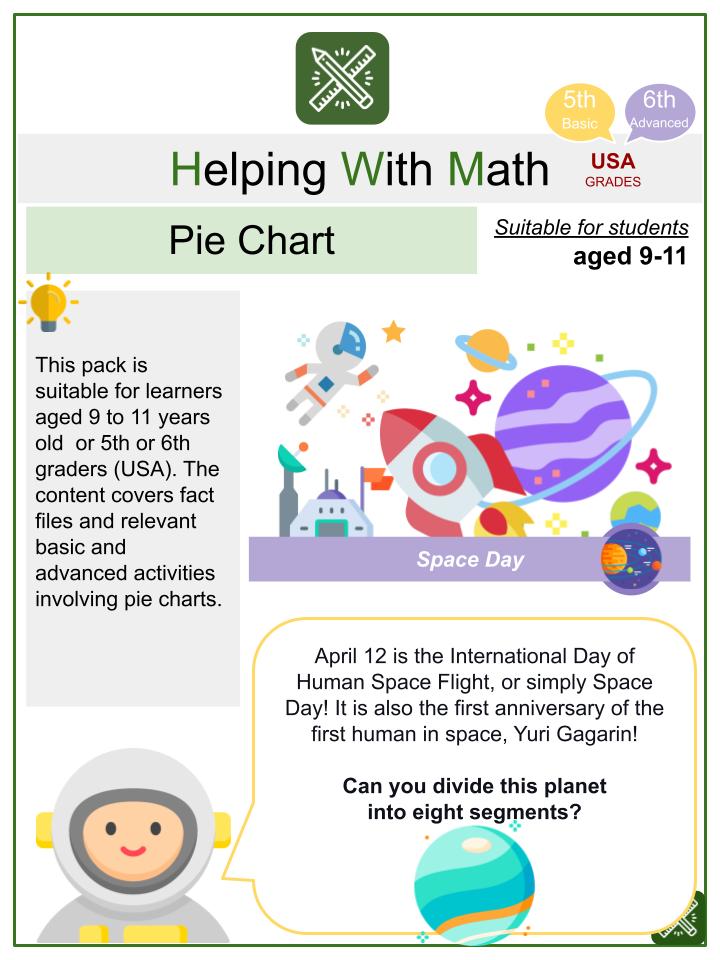
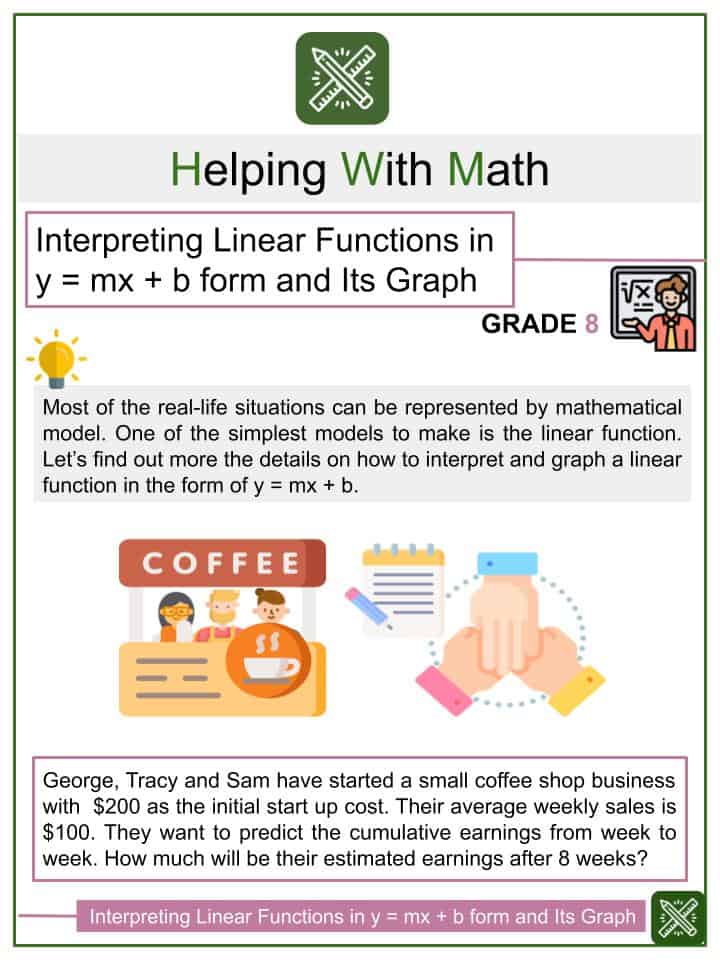
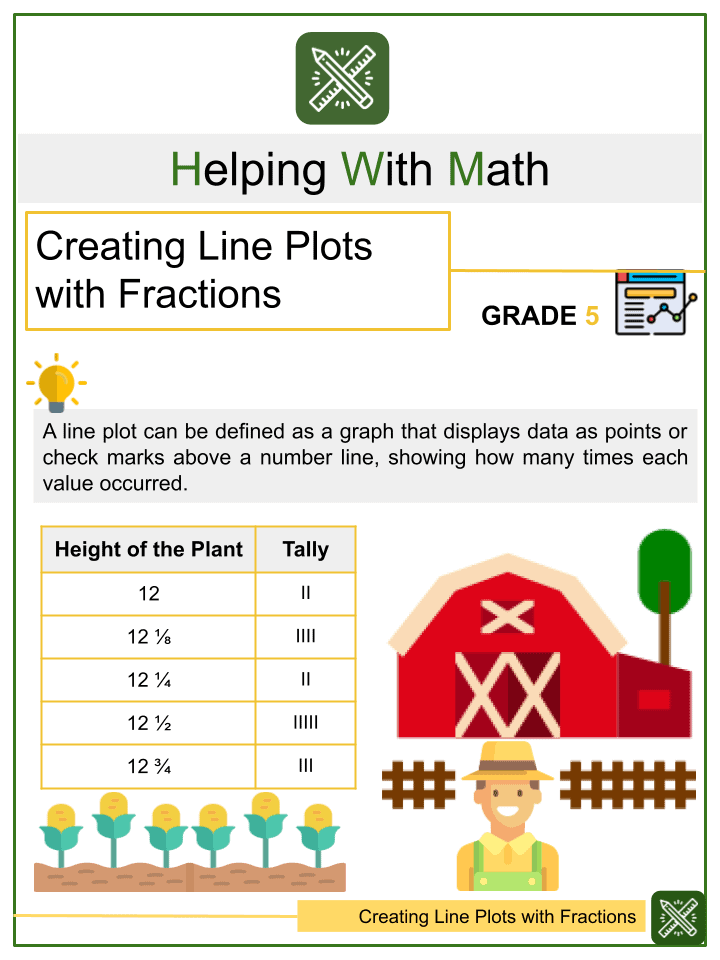
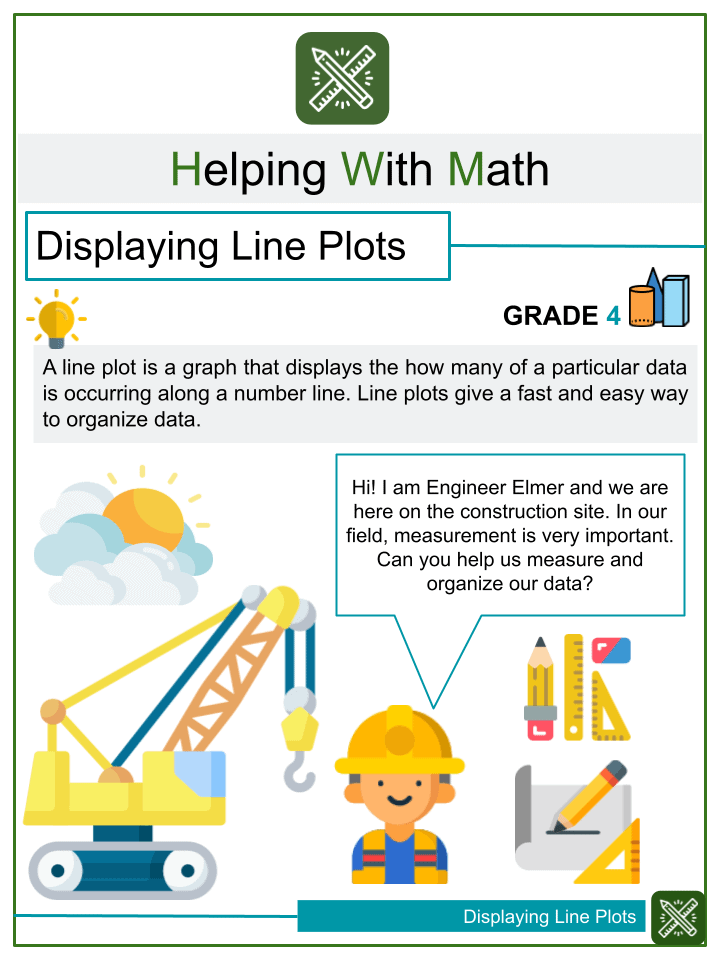
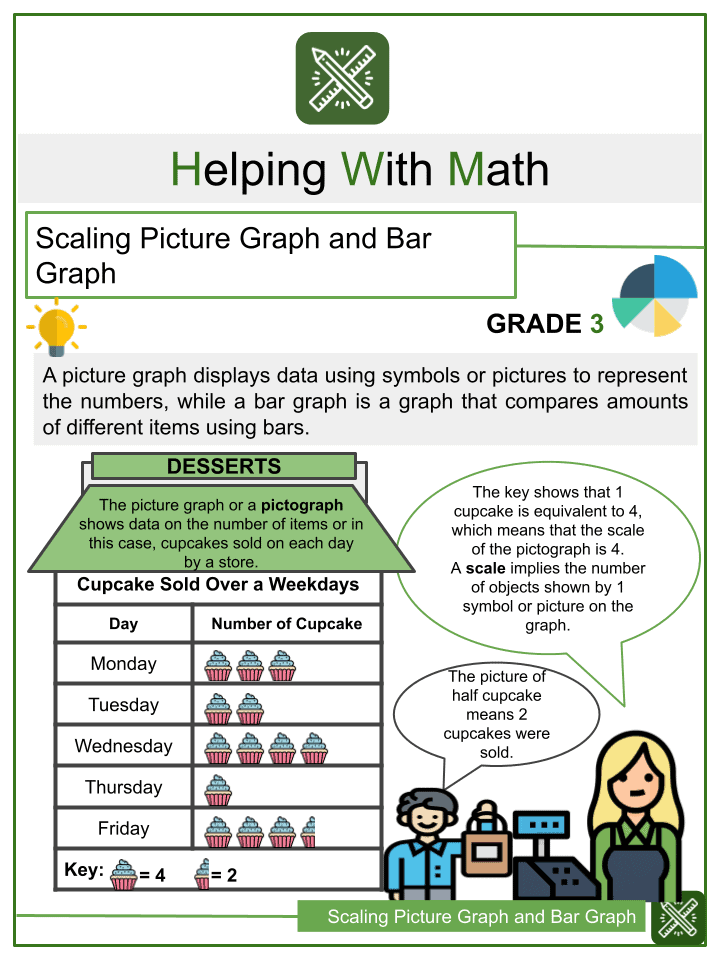
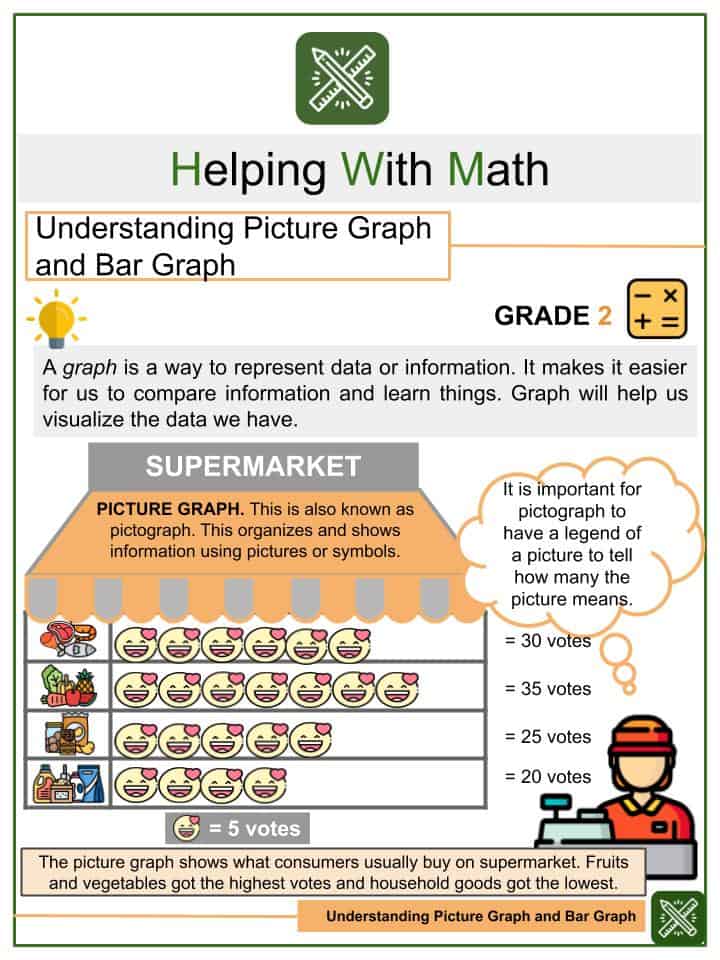
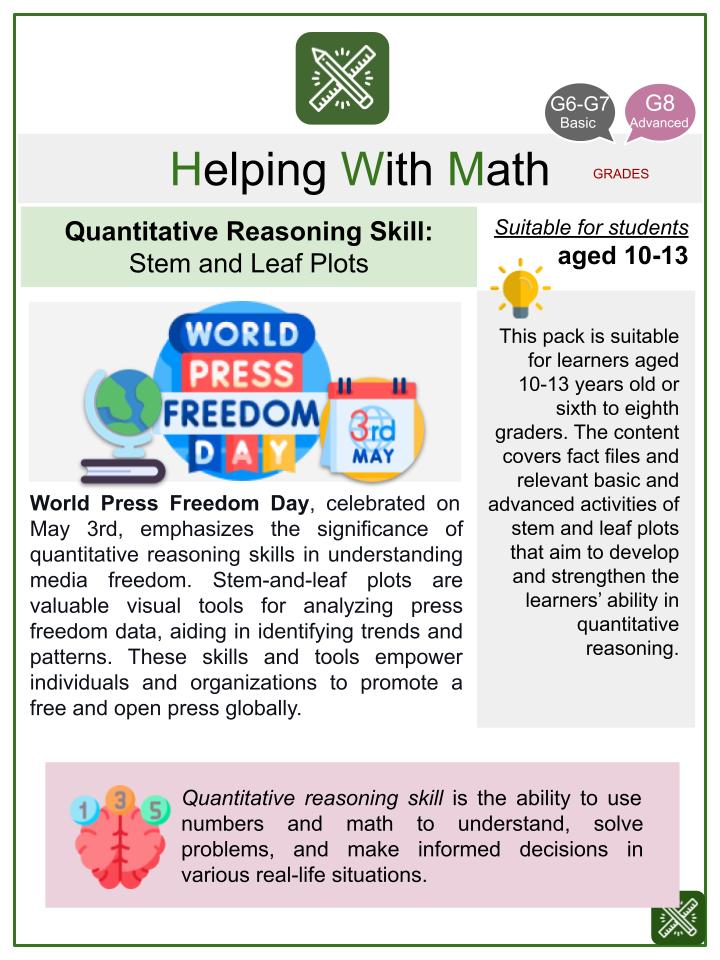
A graph is an organized visual representation of data and values using lines, shapes, and colors. Graphs may also be called charts and usually have two or more points that show the relationship between values. It is usually composed of lines, bars, or proportional areas to clearly see the rate of change when one quantity increases or decreases. Graphing is a subset of data analysis and probability discipline of math. It consists of estimation and all forms of organizing and recording mathematical information.
Importance of the topic:
Graphs, as well as plots, play a vital role in the initial math learning stages. It is because graphing skills are quantitative skills. These give students an idea of multiple representations of mathematical concepts that can be expressed numerically, visually, and symbolically. Graphical skills include: (a) constructing meaningful plots and graphs, (b) plotting x-y data/ordered pairs on a graph, (c) describing plots or graphs, and (d) reading and interpreting data from plots. The study of graphs creates a foundation for more advanced data analysis concepts that will be explored and learned in the later years.
Application of the Learned Topic in Life
Graphing skills provide a more advanced understanding of data analysis and probability. Have you ever wondered how some of the items we use in our everyday lives are created as most of us would want them to be? After coming up with concepts of the products and creating them, companies reach out to a test market to collect data on how they respond to the product. The data gathered is then organized and interpreted into graphs for product development teams to understand better how to improve and develop their products for many people. This process and concept of collecting data and creating graphs for people to quickly understand the outcome to find solutions and better understand things apply to any aspect of our lives.
