What are ordered pairs?
Ordered pairs are sets of numbers used for plotting points. They are always written inside parentheses, and are separated by a comma. Ordered pairs are usually seen together with a four-quadrant graph (also called a coordinate plane).
An ordered pair is a pair of numbers in a specific order. For example, ( 1 , 2 ) and ( 3 , 5 ) are ordered pairs. It is important to understand that in an ordered pair, ( x , y ) is not the same as ( y ,x ). This means that the values ( 3 , 4 ) and ( 4 , 3 ) represent different values on the coordinate plane.
This is a grid that looks like graph paper on which two perpendicular lines cross. The first number in the ordered pair tells you how far across from left to right to move, and the second number tells you how far up and down to move. You draw a small circle or point where the two numbers on the grid cross.
Learning Outcomes
By the end of this lesson, your children will be able to use the terms generated by two numerical patterns to form ordered pairs, plot each point, and join the points to form a line graph. This line graph will show the consistent relationship between the corresponding terms from the two patterns.
Warm Up
Algebra is a category of math that is all about noticing patterns, and the relationships between patterns, and displaying what the patterns are doing using a graph.
The lesson, Generating Patterns & Identifying Relationships, provided practice in making numerical sequences by applying skip-counting rules, such as add 3 or add 6. It looked at the relationship between the rules, and the resulting sequences, and realized that the sequence for the rule add 6 resulted in numbers that were twice as large as the sequence for the rule add 3. This pattern was consistent. It remained the same for all the corresponding terms in the sequences.
A line graph can be used to visually show a consistent relationship, like the one between the two sequences. In order to make a line graph, you need to be able to write ordered pairs using the corresponding terms from the two numerical sequences you are comparing. Let’s look at the numerical sequences for the rules add 3 and add 6.
Starting at zero and using the rule, “Add 3,” we get the sequence:
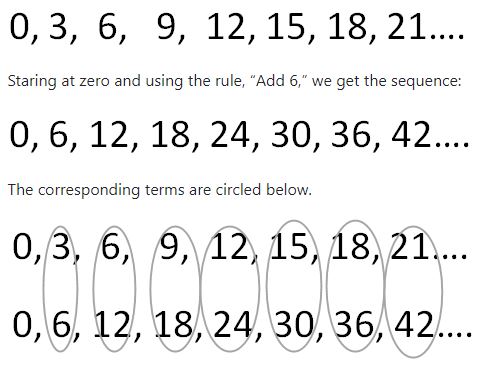
We can use each circled pair to write an ordered pair that can be graphed. The two numbers are written inside a set of parentheses, and are separated by a comma. So these two number sequences give us the ordered pairs: (0,0) (3,6) (6,12) (9,18) (12,24) (15,30) (18,36) (21,42).
How to plot an ordered pair?
An ordered pair is plotted using the Cartesian coordinate system. In this system we define the positions of the two values that constitute the ordered pair. Let us learn more about this system. We can also say that this is a grid that looks like graph paper on which two perpendicular lines cross. The first number in the ordered pair tells you how far across from left to right to move, and the second number tells you how far up and down to move. You draw a small circle or point where the two numbers on the grid cross.
Ordered Pairs & Coordinate Plane Graphing
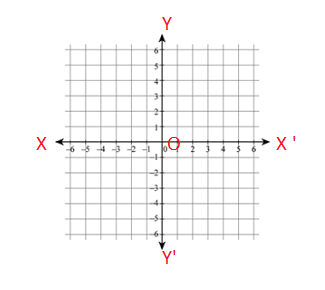
Now that you know how to form ordered pairs from numerical sequences, it is time to learn how to use this information to make a line graph. We will be using a 4-quadrant graph to plot points and make our line graph. A 4-quadrant graph is shown below:
Let’s trying graphing the relationship between two simple numerical sequences: “add 1,” and “add 2.”
These rules give us:
0, 1, 2, 3, 4, 5, 6
0, 2, 4, 6, 8, 10, 12
We form the ordered pairs: (0,0) (1,2) (2,4) (3,6) (4,8) (5,10) (6,12).
A line can then be drawn through the points to show the constant relationship between the two numerical sequences.
Remind your children that the first number in the ordered pair tells how far across, and the second tells how far up and down. They have to use the numbers in the correct order.
The Cartesian Coordinate System
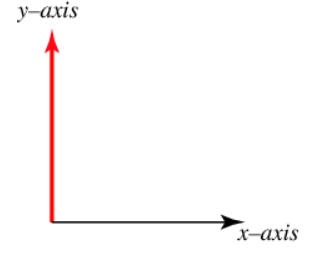
A Cartesian coordinate plane is a system that uses one or more numbers, or coordinates, to uniquely determine the position of a point or other geometric elements. This plane is determined by two perpendicular lines, called the x-axis and the y-axis. Let us learn more about these lines.
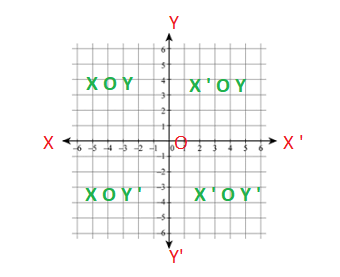
Let X ‘ O X and Y ‘ O Y be two mutually perpendicular lines through a point O in the plane of a graph paper as shown below.
The line X O X ‘ is called the x-axis or axis of x and the line Y O Y ‘ is called the y-axis or the axis of y. The two lines X O X ‘ and Y O Y ‘ taken together are called the coordinate axis or the axis of the coordinate system. The point O is called the point of origin. This can also be represented as –
Quadrants of the Coordinate System
The x-axis and the y-axis together divide the entire coordinate system into four equal parts which are called the quadrants of the coordinate system.
For example, in the graph of the coordinate axis that we have defined above, the two lines X O X ‘ and Y O Y ‘ divide the plane of the graph paper into four regions, namely, X O Y, X ‘ O Y , X ‘ O Y ‘ and Y ‘ O X. These four regions are called the quadrants.
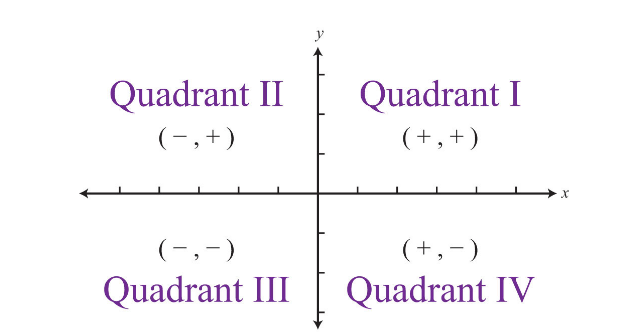
The ray O X ‘ is taken as a positive x-axis and the O X is taken as negative x-axis. Similarly, the ray O Y is taken as a positive y-axis and the O y ‘ is taken as negative y-axis. The signs of the x coordinate and the y coordinate in the four quadrants are thus defined as –
1 st Quatarant – x > 0 and y > 0
2 nd Quadrant – x < 0 and y > 0
3 rd Quarant – x < 0 and y < 0
4 th Quadrant – x > 0 and y < 0
Graphically, the values and x and y in the four quadrants can be represented as –
Now let us see how to identify the coordinates of y in accordance with the coordinates of x on the x –y axis.
Identifying X and Y Coordinates
In coordinate geometry, being able to identify the coordinates of a point shown on a graph is just as important as being able to plot points. To identify the x-coordinate of a point on a graph, read the number on the x-axis directly above or below the point. To identify the y-coordinate of a point, read the number on the y-axis directly to the left or right of the point. Remember, to write the ordered pair using the correct order
Let us understand this by an example.
Suppose we have the following point on the x-y axis.
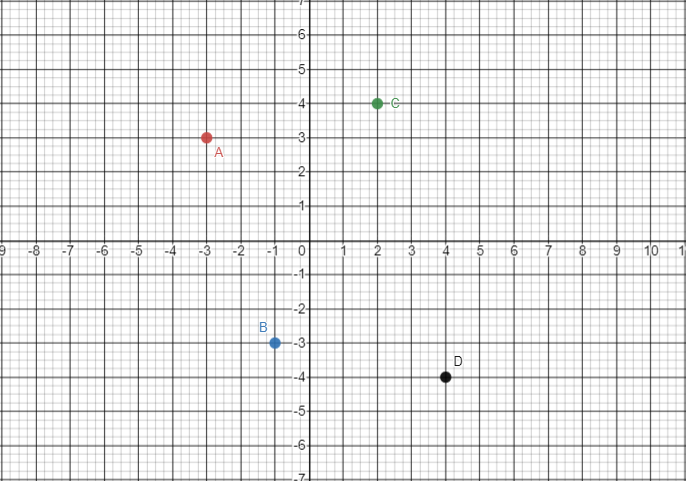
Let us check the plotting of the points A, B, C and D.
Identifying Coordinates of Point A
We can clearly see that the point A is above – 3 on the x axis. This means that the x coordinate of the point A is – 3. Now, the point A is to the left of 3 on the y axis. This means that the y coordinate of the point A is 3.
Hence the coordinates of the point A are ( -3, 3 ).
Identifying Coordinates of Point B
We can clearly see that the point B is below – 1 on the x axis. This means that the x coordinate of the point B is – 1. Now, the point B is to the left of – 3 on the y axis. This means that the y coordinate of the point B is – 3.
Hence the coordinates of the point B are ( – 1, – 3 ).
Identifying Coordinates of Point C
We can clearly see that the point C is above 2 on the x axis. This means that the x coordinate of the point C is 2. Now, the point C is to the right of 4 on the y axis. This means that the y coordinate of the point C is 4.
Hence the coordinates of the point C are ( 2 , 4 ).
Identifying Coordinates of Point D
We can clearly see that the point D is below 4 on the x axis. This means that the x coordinate of the point C is 4. Now, the point D is to the right of – 4 on the y axis. This means that the y coordinate of the point D is – 4.
Hence the coordinates of the point C are ( 4 , – 4 ).
Now let us see how to plot the coordinates of y in accordance with the coordinates of x on the x –y axis.
Plotting X and Y Coordinates
It is important to note here that the order in which you write x- and y-coordinates in an ordered pair is very important. The x-coordinate always comes first, followed by the y-coordinate. Therefore, the ordered pairs ( 3 , 4 ) and ( 4 , 3 ) are two different points.
Hence, we can say that the first number in the brackets relates to the x axis. Also, the second number in the brackets relates to the y axis.
Let us consider an example.
Suppose we want to plot the point ( 2 , 3 ) on the x-y plane.
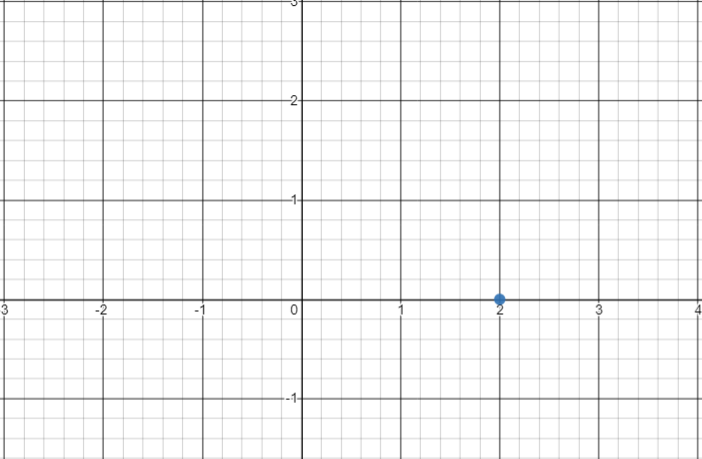
First let us consider the first point, i..e 2. We know that the first number in the brackets relates to the x axis, therefore, we will highlight 2 on the x-axis as shown below.
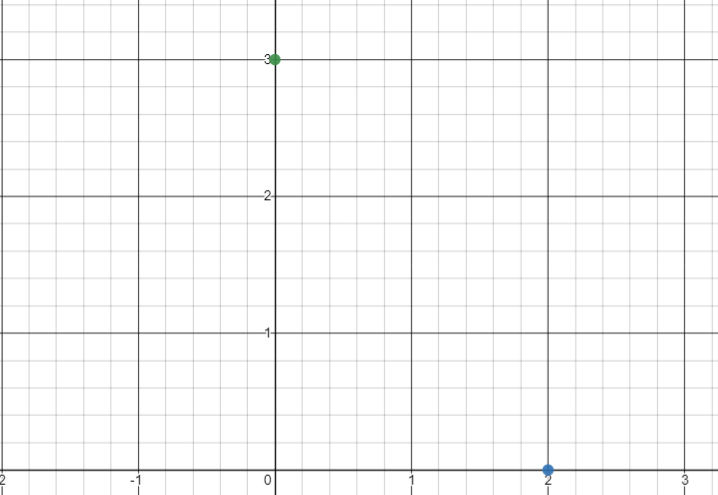
Next, we will check the value of the second coordinate. We have been given the value 3. Now, we know that the second number in the brackets relates to the y axis. Therefore, we will mark 3 on the y axis as shown below –
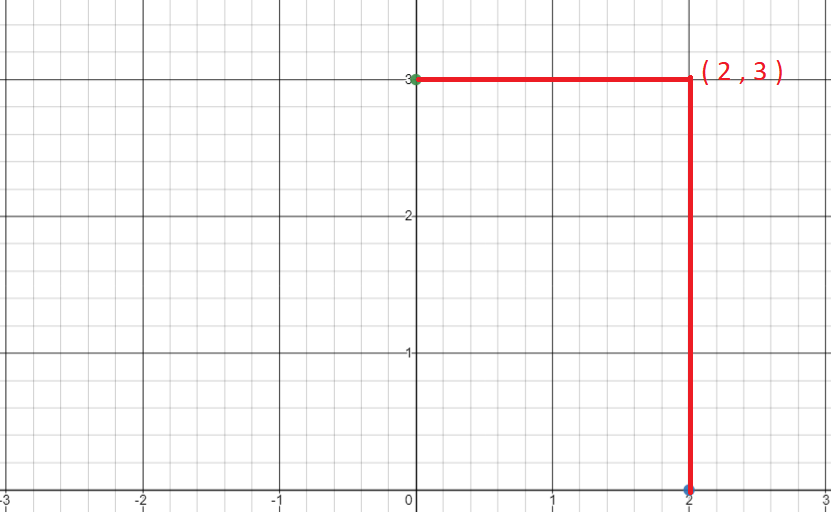
Now, the intersection of these two points on the plane will be out point ( 2 , 3 ) which is shown in the graph below –
Cartesian Coordinates of a Point
Let X ‘ O X and Y ‘ O Y be the coordinate axis and let P be any point in the plane of the paper. Let us draw a line P M perpendicular to the X ‘ O X and P N perpendicular to the Y ‘ O Y.
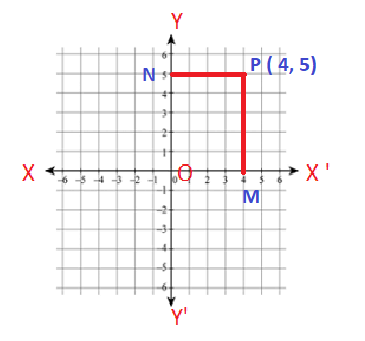
The length of the line segment O M is called the x-coordinate or abscissa of point P and the length of the directed line segment On is called the y-coordinate or ordinate. Let O M =x and O N = y. Then the position of the point P in the plane with respect to the coordinate axis is represented by the ordered pair ( x , y ). This ordered pair ( x , y ) is called the coordinates of point P.
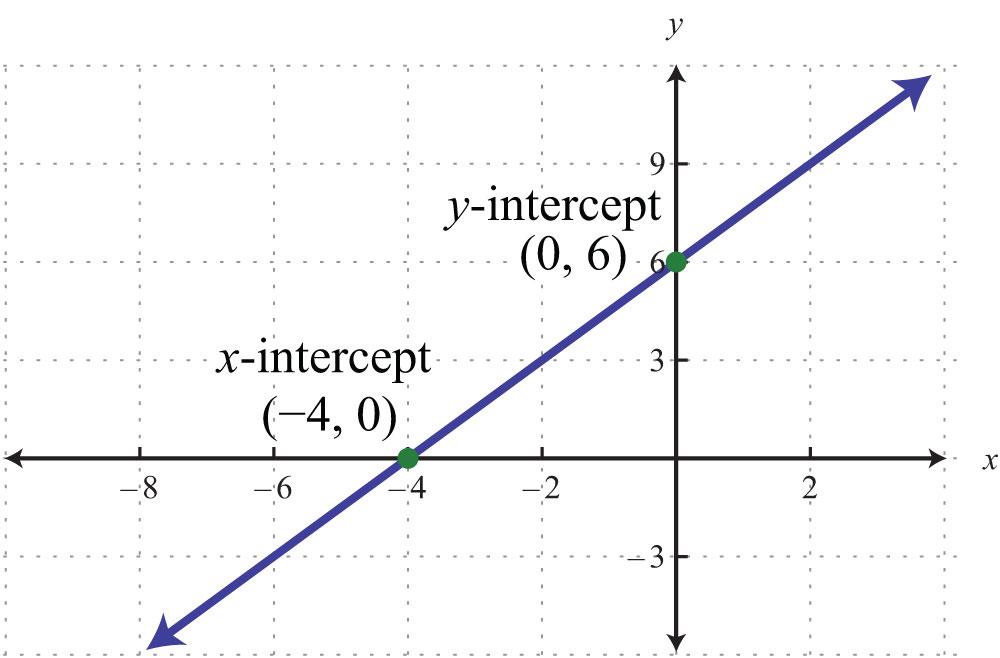
The X intercept and Y intercept
The intercepts of a graph are points at which the graph crosses the axis. Therefore, by this definition, the y-intercept is the point at which the graph crosses the y-axis. At this point, the x-coordinate is zero. . The coordinates of the y intercept are always in the form of ( 0 , y ).
Similarly, the x-intercept is defined as the point at which the graph crosses the x-axis. At this point, the y-coordinate is zero. The coordinates of the x intercept are always in the form of ( x , 0 ).
Let us understand this through an example. Suppose on a graph we wish to plot a line that passes the x axis at -4 units and the y axis at 6 units. In this case, the point on the x axis will be ( -4 , 0 ) and the point on the y-axis will be ( 0, 6 ). The points thus plotted on the graph will be as represented in the figure below –
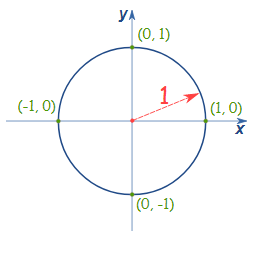
Use of ordered pairs in Trigonometry
Ordered pairs are used to define points on a unit circle which is an integral constituent of trigonometry. The unit circle plays a significant role in a number of different areas of mathematics. The equation of a unit circle is derived using the concept of ordered pair. The equation of the circle is derived from the equation of the circle and it has all the properties of the circle. In other words, the equation of a unit circle is represented using the second-degree equation with two variables x and y.
We know that the general equation of a circle is given by
( x – a )2 + ( y – b )2 = r2, where,
The centre of the circle is given by the point ( a, b ) and the radius of the circle is r.
Now, we will use the above equation to derive the general equation of the unit circle.
We have just learnt that the radius of the unit circle is one unit while the centre of the unit circle lies at the point of origin, i.e. (1, 1 )
Therefore, for the above equation, in case of unit circle,
r = 1 and ( a, b ) = ( 0, 0 )
Substituting these values of ( a, b ) and r in the above equation, we will get
( x – 0 )2 + ( y – 0 )2 = 12
⇒ x2 + y2 =1
Solved Examples
Example 1 Name the ordered pair containing the x and the y coordinates of the points marked in the given graph.
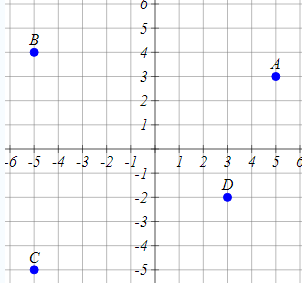
Solution We have been given four points, A, B, C and D. We need to find the x coordinate and the y coordinates of these four points. Let us find them one by one.
Identifying Coordinates of Point A
We can clearly see that the point A is above 5 on the x axis. This means that the x coordinate of the point A is 5. Now, the point A is to the right of 3 on the y axis. This means that the y coordinate of the point A is 3.
Hence the coordinates of the point A are ( 5 , 3 ).
Identifying Coordinates of Point B
We can clearly see that the point B is above – 5 on the x axis. This means that the x coordinate of the point B is – 5. Now, the point B is to the left of 4 on the y axis. This means that the y coordinate of the point B is 4.
Hence the coordinates of the point B are ( – 5 , 4 ).
Identifying Coordinates of Point C
We can clearly see that the point C is below – 5 on the x axis. This means that the x coordinate of the point C is – 5. Now, the point C is to the left of – 5 on the y axis. This means that the y coordinate of the point C is – 5.
Hence the coordinates of the point B are ( – 5 , – 5 ).
Identifying Coordinates of Point D
We can clearly see that the point D is below 3 on the x axis. This means that the x coordinate of the point D is 3. Now, the point D is to the right of – 2 on the y axis. This means that the y coordinate of the point D is – 2.
Hence the coordinates of the point B are ( 3 , – 2 ).
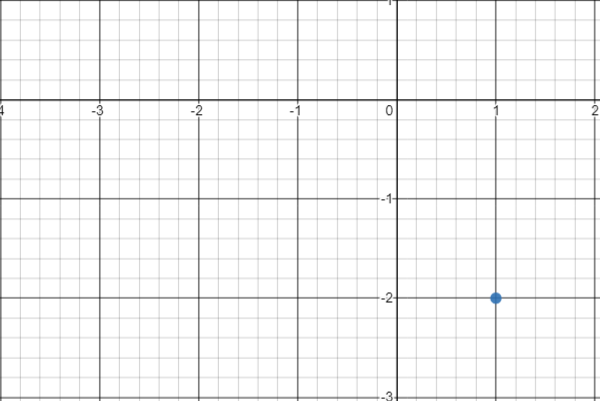
Example 2 Plot the coordinate ( 1, -2 ) on the x-y plane.
Solution We have been given the coordinate ( 1 , – 2 ). We need to plot it on the xy-plane. We will follow the following steps to plot the given coordinate of the xy plane.
- Remember the first number in the brackets relates to the x axis.
- The -1 means move one place, but because there is a minus sign in front of it, this time we move one place to the left, along the x axis.
- The second number in the brackets relates to the y axis.
- The 2 means move two places up, along the y axis.
Key Facts and Summary
- An ordered pair is a pair of numbers in a specific order.
- A Cartesian coordinate plane is a system which uses one or more numbers, or coordinates, to uniquely determine the position of a point or other geometric elements.
- Let X ‘ O X and Y ‘ O Y be two mutually perpendicular lines through a point O in the plane of a graph paper. The line X O X ‘ is called the x-axis or axis of x and the line Y O Y ‘ is called the y-axis or the axis of y. The two lines X O X ‘ and Y O Y ‘ taken together are called the coordinate axis or the axis of the coordinate system. The point O is called the point of origin.
- The x-axis and the y-axis together divide the entire coordinate system into four equal parts which are called the quadrants of the coordinate system.
- While plotting coordinates on a x – y plane, the x-coordinate always comes first, followed by the y-coordinate.
- The y-intercept is the point at which the graph crosses the y-axis. At this point, the x-coordinate is zero. . The coordinates of the y intercept are always in the form of ( 0 , y ). Similarly, the x-intercept is defined as the point at which the graph crosses the x-axis. At this point, the y-coordinate is zero. The coordinates of the x intercept are always in the form of ( x , 0 ).
Recommended Worksheets
Number Patterns (Farm Themed) Worksheets
Cartesian Coordinate Plane (Adventure Themed) Worksheets
Graphing Lines in Slope-Intercept Form (Famous African-Americans Themed) Math Worksheets