Introduction
The pairing of the elements is shown in the mapping diagram. It represents the input and output values of a function like a flowchart. To depict the relationship between any two elements, lines or arrows are drawn from the domain to the range.
We will learn more about mapping diagrams in this article and use them to show relationships and functions.
What is a Mapping Diagram?
A mapping diagram has two columns, one of which designates a function’s domain and the other its range. Arrows or lines are drawn between the domain and the range to show the relationship between two items.
Creating Mapping Diagrams
Two columns that are parallel make up a mapping diagram. A function’s domain is shown in the first column, and its range is shown in the second column. The relationship between any two items is shown by lines or arrows traced from domain to range.
The following are the easy steps to creating a mapping diagram.
Step 1: Create two circles or ovals next to one another.
Step 2: List every input value in the circle or oval.
Step 3: List every output value in the right circle or oval.
Step 4: Connect each input value to its corresponding output value with an arrow, and repeat the process until all pairs have been matched.
Furthermore, only one listing is required for each value that appears more than once in either circle or oval, and multiple arrows can be used to signify that duplication.
Examples
Example 1
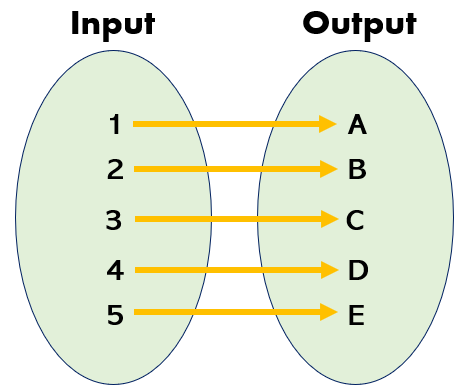
Create a mapping diagram for the information in the table below.
| Input | Output |
| 1 | A |
| 2 | B |
| 3 | C |
| 4 | D |
| 5 | E |
Solution
Let us follow the steps in creating a mapping diagram.
Step 1: Create two circles or ovals next to one another.
Ensure that the oval displaying the input or output values is labeled.
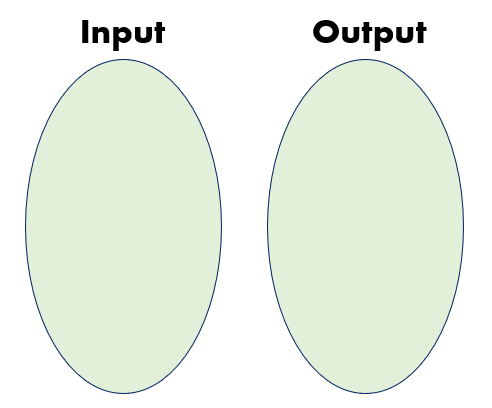
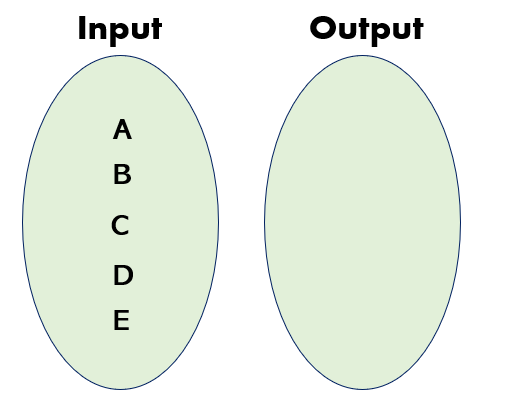
Step 2: List every input value in the circle or oval.
There are five elements in the input oval.
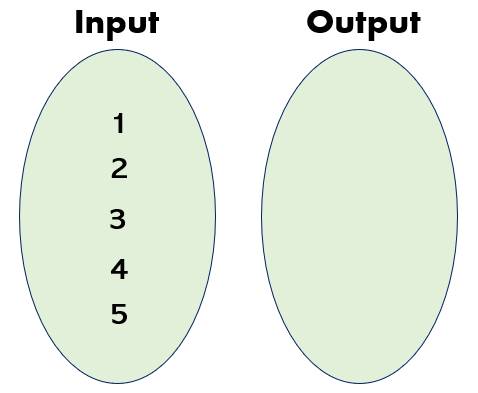
Step 3: List every output value in the right circle or oval.
There are five elements in the output oval.
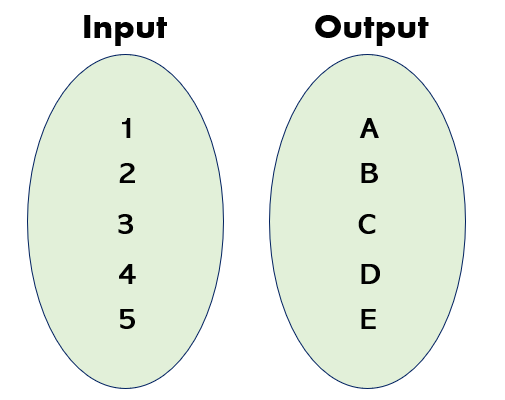
Step 4: Connect each input value to its corresponding output value with an arrow and repeat the process until all pairs have been matched.
The two circles or ovals with the labels input and output and their elements are displayed in the illustration below.
Example 2
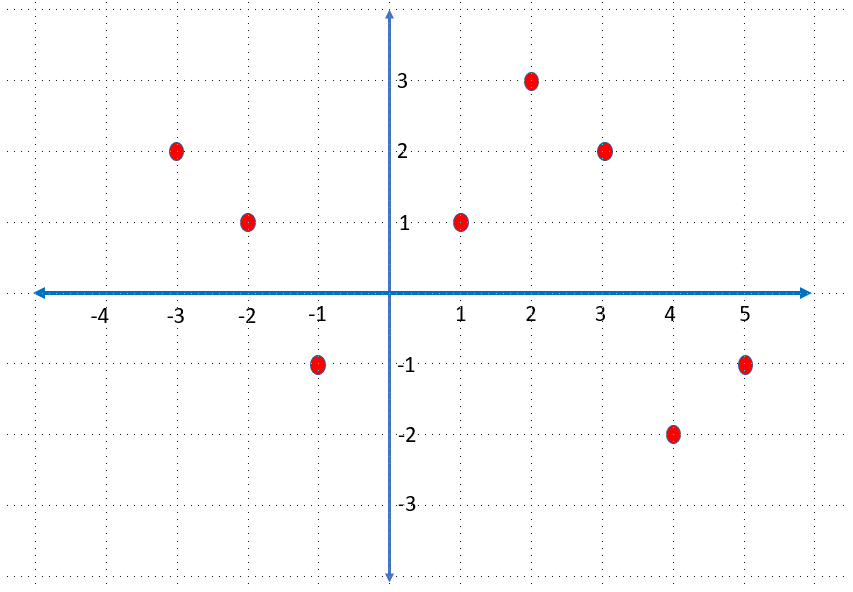
Use a mapping diagram to represent the relation.
Solution
Let us first list the points shown in the graph as ordered pairs. So, we have,
( -3, 2 ) , ( -2, 1 ) , ( -1, -1 ) , ( 1, 1 ) , ( 2, 3 ) , ( 3, 2 ) , ( 4, -2 ) , ( 5, -1 )
All x – values are the input values, while the y -values are the output values.
Step 1: Create two circles or ovals next to one another.
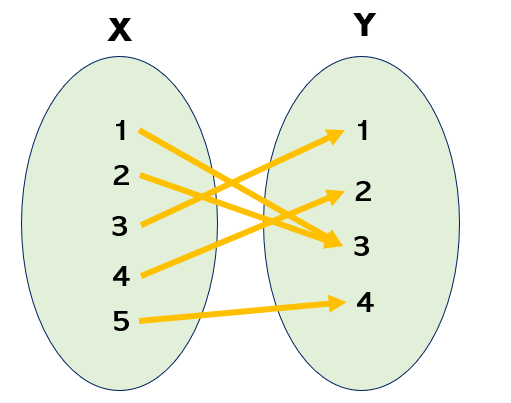
Let us label the input values X and the output values Y.
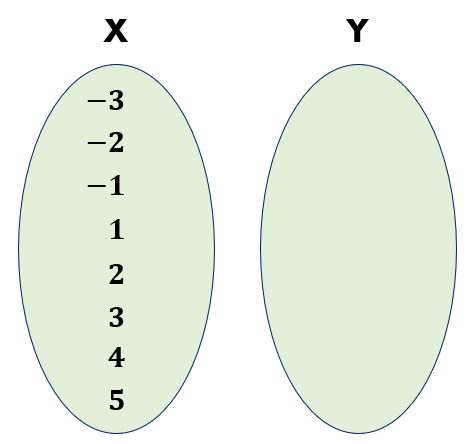
Step 2: List every input value in the circle or oval.
There are eight elements in the input or x – values.
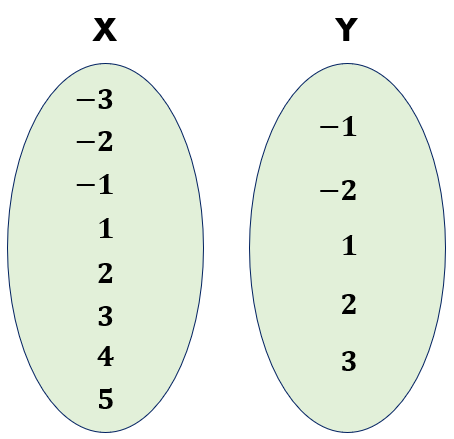
Step 3: List every output value in the right circle or oval.
There are only five elements in the output or y – values. Notice that only one listing is required for each value that appears more than once. The numbers -1, 1 2 are the numbers that appeared more than once in the output values.
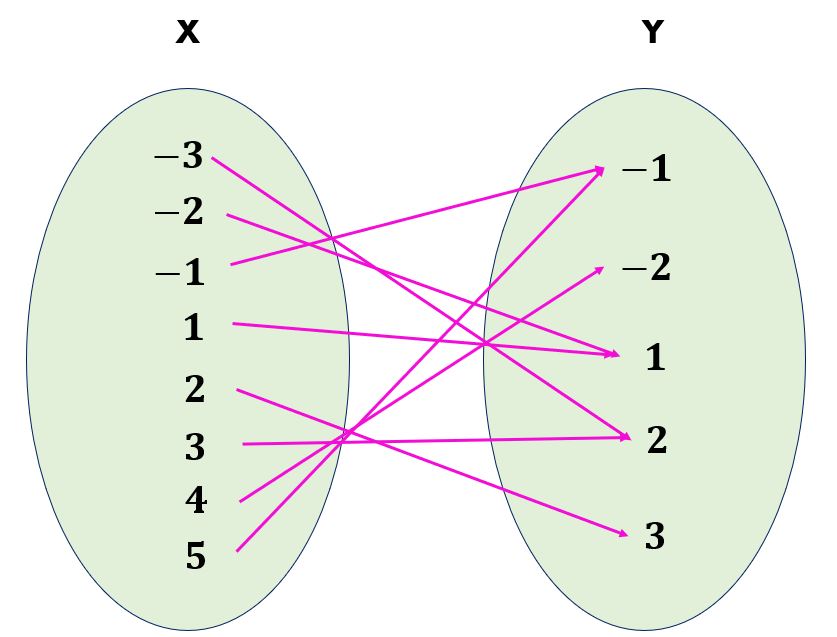
Step 4: Connect each input value to its corresponding output value with an arrow and repeat the process until all pairs have been matched.
The mapping diagram below shows the relation of the given graph above.
Example 3
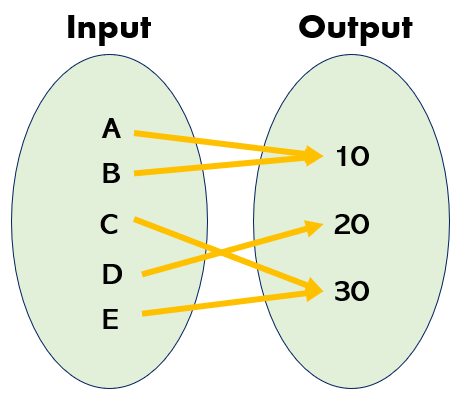
Create a mapping diagram for the information in the table below.
| Input | Output |
| A | 10 |
| B | 10 |
| C | 30 |
| D | 20 |
| E | 30 |
Solution
Let us follow the steps in creating a mapping diagram.
Step 1: Create two circles or ovals next to one another.
Ensure that the oval displaying the input or output values is labeled.

Step 2: List every input value in the circle or oval.
There are five elements in the input oval.
Step 3: List every output value in the right circle or oval.
There are five elements in the output oval.
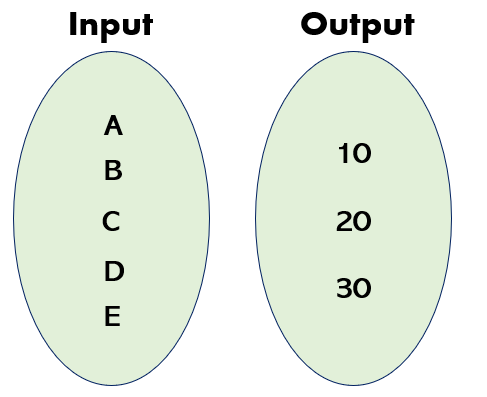
Step 4: Connect each input value to its corresponding output value with an arrow, and repeat the process until all pairs have been matched.
The two circles or ovals with the labels input and output and their elements are displayed in the illustration below.
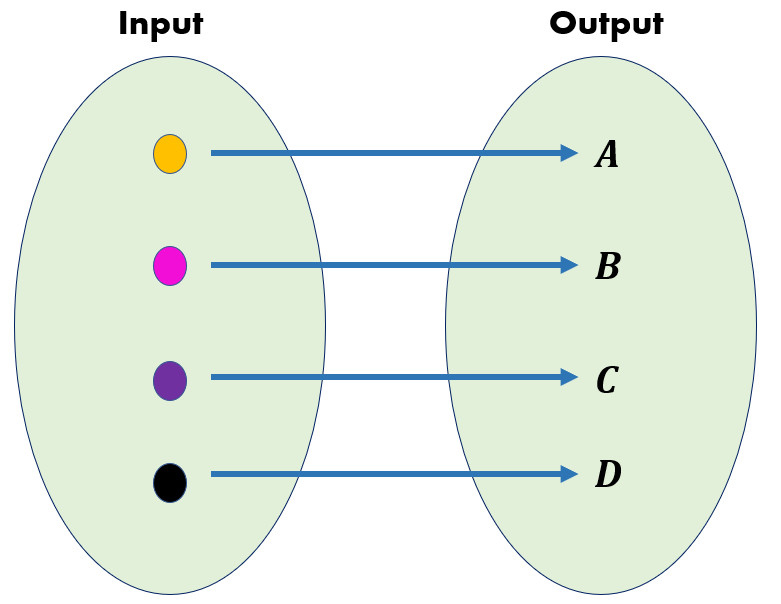
One-to-One Mapping
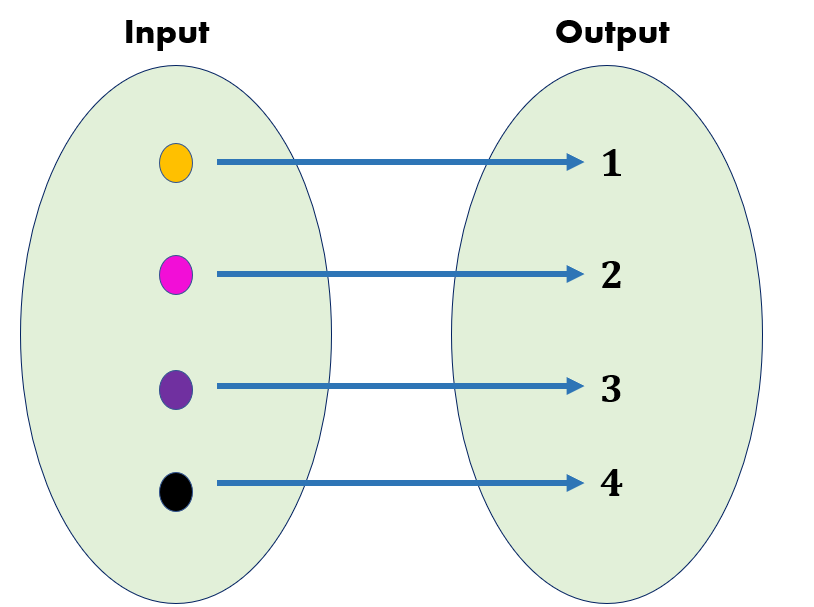
One-to-one mapping is a function represented by the mapping below, where each output member is associated with exactly one input member.
The image below shows that each element in the input values corresponds to exactly one element in the output values.
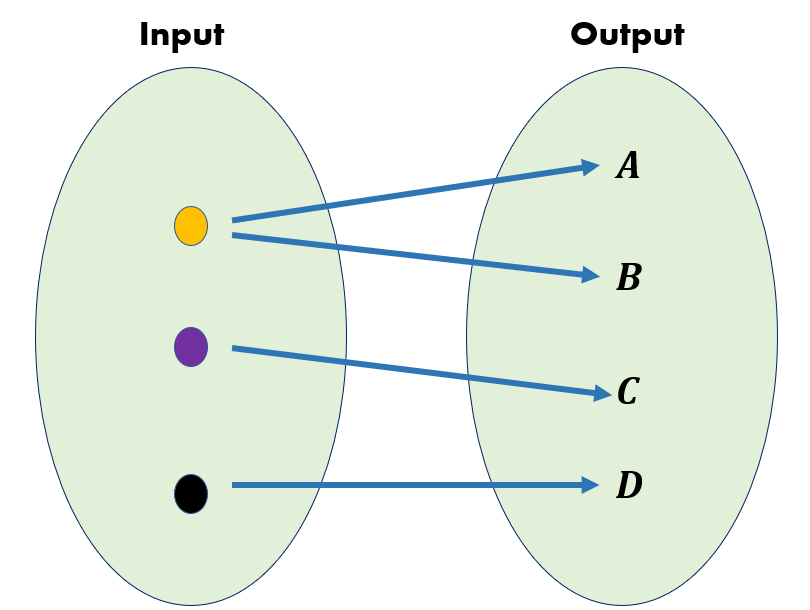
One-to-Many Mapping
A one-to-many relation exists when one element in the input values is mapped to multiple elements in the output values. Functions are not one-to-many relations.
The image below shows that an element in the input values corresponds to two different elements in the output values.
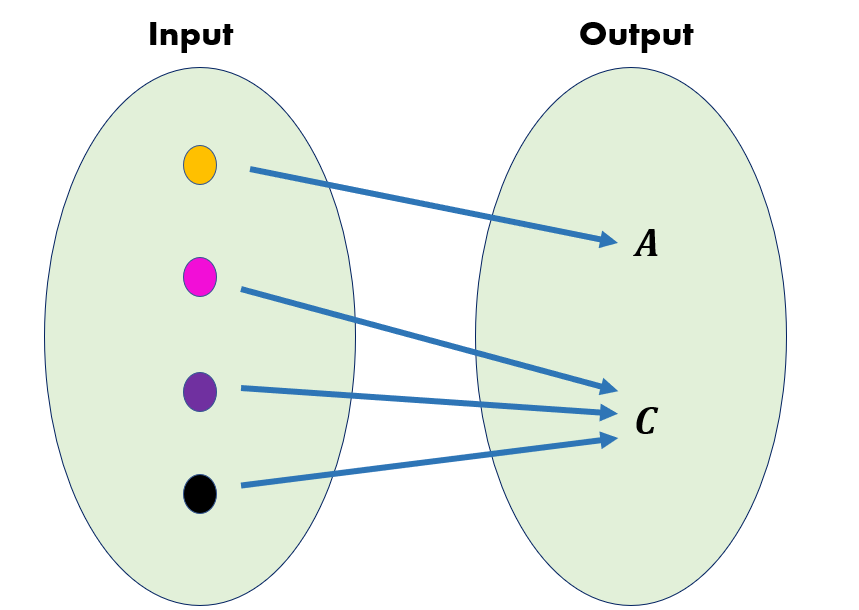
Many-to-One Mapping
The elements in the output in the mapping diagram designate several elements in the input.
The image below shows that three elements in the input values correspond to the same element in the output values.

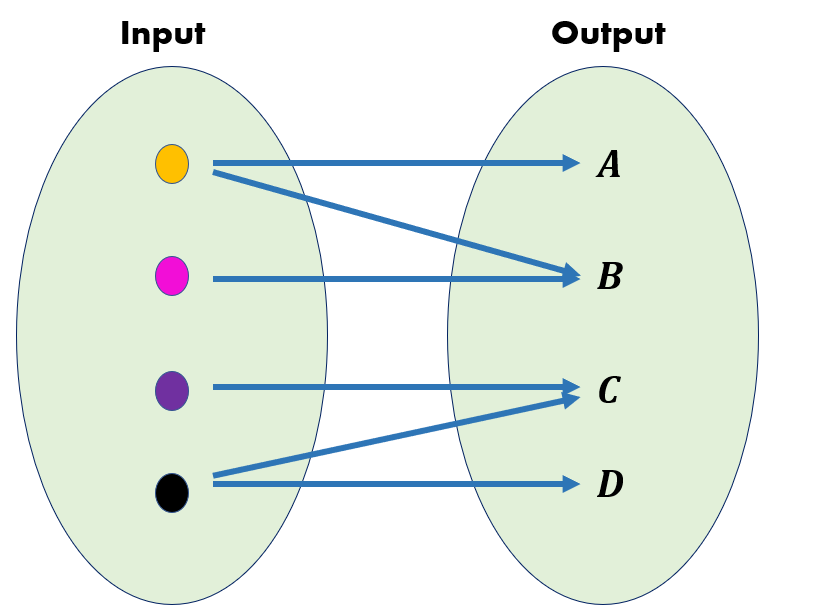
Many-to-Many Mapping
A many-to-many relation exists when multiple elements in the input values are mapped to multiple elements in the output values. Functions are not many-to-many relations.
The image below shows that multiple elements in the input values correspond to multiple elements in the output values.
Relation and Function
Functions are relations that link one set of inputs to another set of outputs. In contrast, relations are a group of ordered pairings connecting one set of objects to another set of objects. As a result, all relations are not functions, and all functions are relations.
What is a Relation?
An ordered pair collection is called a relation. The relationship between two separate sets of information is generally defined by the term “relation.” A point with both x and y coordinates is known as an ordered pair. Relations can be presented in three different ways: as a table, a graph, or a mapping diagram.
Let us have a look at two sets, x and y, where x and y are related. Domain and range are terms used to describe the values of sets x and y, respectively. Let us have the ordered pairs below as an example and illustrate these pairs using a mapping diagram.
Ordered pairs: ( 2, 3 ) , ( 5, 4 ) , ( 3, 1 ) , ( 1, 3 ) and ( 4 , 2 )
What is a function?
All relations are functions, but not all functions are relations. This is such that one input can only link to one output—never to more than one. One-to-one and Many-to-one relations are examples of functions.
| One-to-one | Many-to-one |
The above diagrams illustrate that no two input value elements are connected to an output value element.
More Examples
Example 1
Analyze the mapping diagram to see if the relationship is a function.
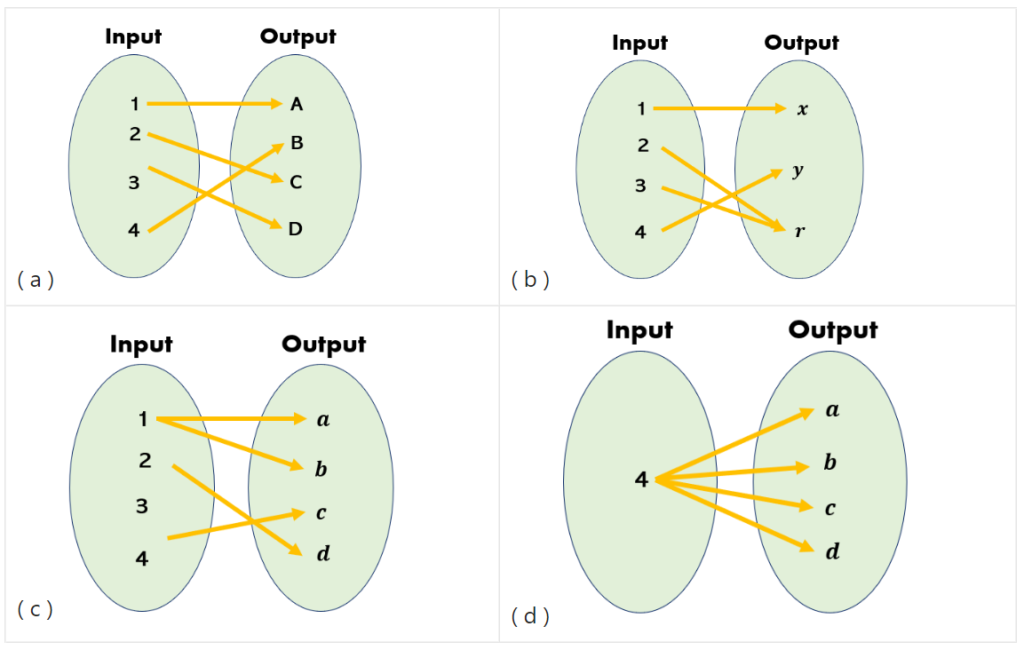
Solution
( a )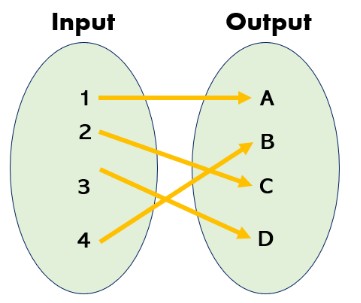 The relationship shown in the above mapping diagram is a function since each input value is paired with only one output value. | ( b )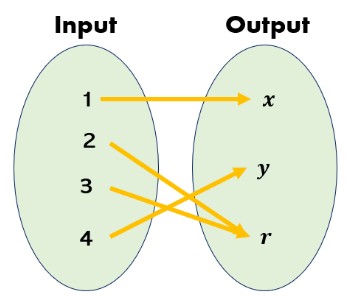 The mapping diagram above shows a function. Although 2 and 3 have the same output value, what is important is that no input value has more than one output value. |
( c )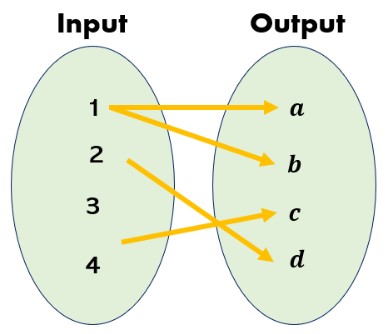 The mapping diagram above is not a function since 1 is paired with more than one output value, a, and b. | ( d )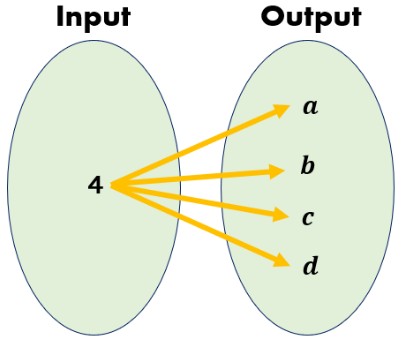 The mapping diagram above is not a function since 4 is paired with more than one output value a, b, c, and d. |
Example 2
Draw a mapping diagram for the function y = 3x2 + 4 in the set of real numbers.
Solution
Pick a few elements from the domain first. Then, determine the range of y values by substituting the elements in the domain. Let us say, for example, let us use the following x – values, -2, -1, 0, 1, 2, 3, and 4.
Each x-value is entered into the function to determine its range.
| when x = -2 y = 3 ( -2 )2 + 4 y = 3 ( 4 ) + 4 y = 12 + 4 y = 16 | when x = -1 y = 3 ( -1 )2 + 4 y = 3 ( 1 ) + 4 y = 3 + 4 y = 7 | when x = 0 y = 3 ( 0 )2 + 4 y = 3 ( 0 ) + 4 y = 0 + 4 y = 4 |
| when x = 1 y = 3 ( 1 )2 + 4 y = 3 ( 1 ) + 4 y = 3 + 4 y = 7 | when x = 2 y = 3 ( 2 )2 + 4 y = 3 ( 4 ) + 4 y = 12 + 4 y = 16 | when x = 3 y = 3 ( 3 )2 + 4 y = 3 ( 9 ) + 4 y = 27 + 4 y = 31 |
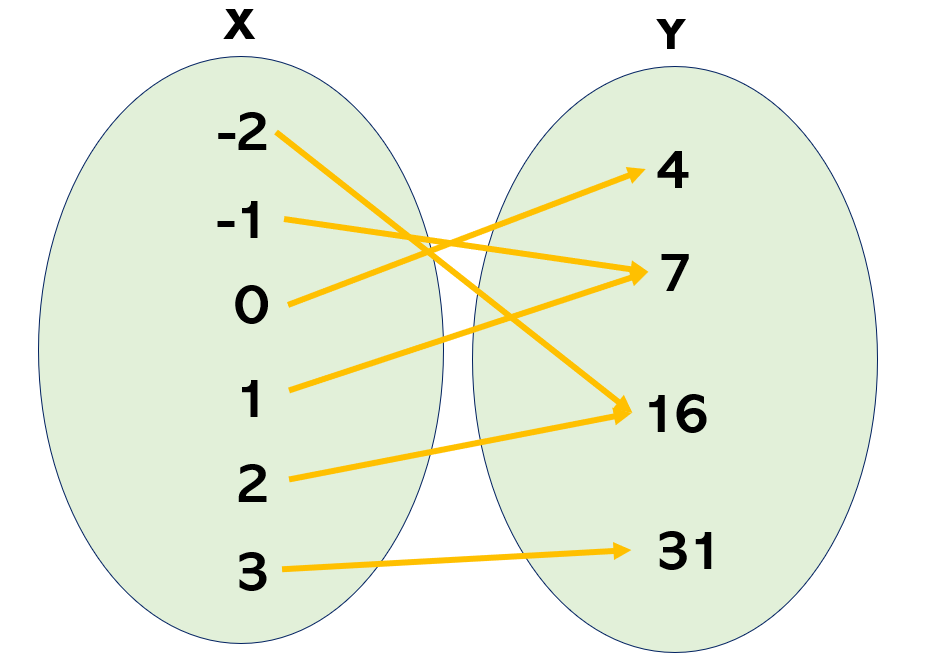
If we look at the solution as ordered pairs, we have,
{ ( -2, 16 ), ( -1, 7 ), ( 0 , 4 ), ( 1, 7 ), ( 2, 16 ), ( 3, 31 ) }
To create the mapping diagram, we must list every input value (domain) in one circle or oval, followed by every output value in the other (range), to create a mapping diagram. Then, an arrow connects each input value to its corresponding output value.
The image below shows a mapping diagram for the given.
Example 3
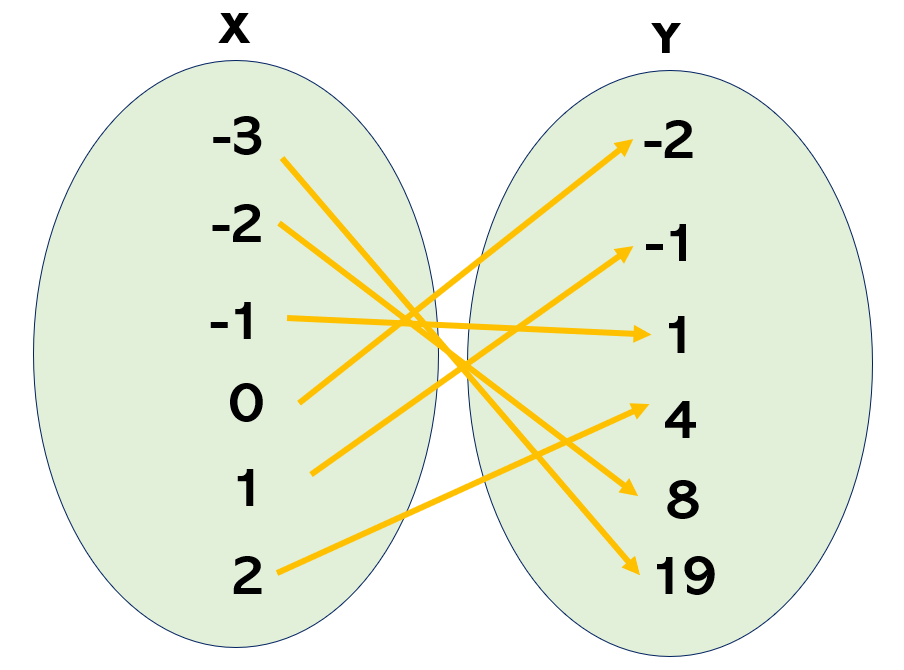
Create a mapping diagram for the function y = 2x2 – x – 2 using the input values -3, -2, -1, 0, 1, and 2.
Solution
Let us plug in the given values in the given function.
Each x-value is entered into the function to determine its range.
| when x = -3 y = 2 ( -3 )2 – ( -3 ) – 2 y = 2 ( 9 ) + 3 – 2 y = 18 + 3 – 2 y = 19 | when x = -2 y = 2 ( -2 )2 – ( -2 ) – 2 y = 2 ( 4 ) + 2 – 2 y = 8 + 2 – 2 y = 8 | when x = -1 y = 2 ( -1 )2 – ( -1 ) – 2 y = 2 ( 1 ) + 1 – 2 y = 2 + 1 – 2 y = 1 |
| when x = 0 y = 2 ( 0 )2 – ( 0 ) – 2 y = 2 ( 0 ) – 0 – 2 y = 0 – 0 – 2 y = -2 | when x = 1 y = 2 ( 1 )2 – ( 1 ) – 2 y = 2 ( 1 ) – 1 – 2 y = 2 – 1 – 2 y = -1 | when x = 2 y = 2 ( 2 )2 – ( 2 ) – 2 y = 2 ( 4 ) – 2 – 2 y = 8 – 2 – 2 y = 4 |
If we look at the solution as ordered pairs, we have,
{ ( -3, 19 ), ( -2, 8 ), ( -1 , 1 ), ( 0, -2 ), ( 1, -1 ), ( 2, 4 ) }
To create the mapping diagram, we must list every input value (domain) in one circle or oval, followed by every output value in the other (range), to create a mapping diagram. Then, an arrow connects each input value to its corresponding output value.
The image below shows a mapping diagram for the given.

Example 4
Draw a mapping diagram for the ordered pairs below and identify the domain and range.
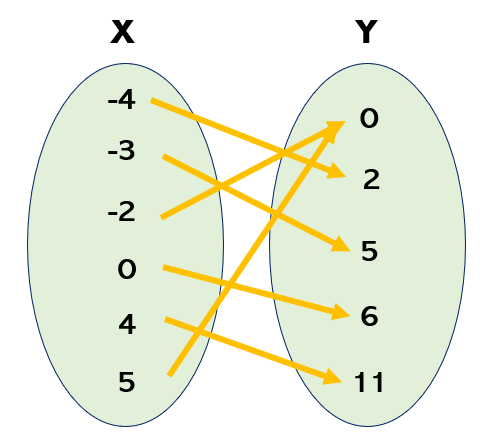
{ ( -4, 2 ) , ( -3, 5 ), ( -2, 0 ), ( 0, 6 ), ( 4, 11 ) , ( 5, 0 ) }
Solution
Using the ordered pairs above, we can find the domain by listing all the x – values. To find the range is to list all the y – values. When listing the numbers, make sure they are written from least to greatest.
Domain : { -4, -3, -2, 0, 4, 5 }
Range : { 0, 2, 5, 6, 11 }
Let us follow the steps below to draw the mapping diagram.
Step 1: Create two circles or ovals next to one another.
Step 2: List every input value in the circle or oval.
Step 3: List every output value in the right circle or oval.
The image below shows the mapping diagram of the given set of ordered pairs.
Example 5
Use a table of values and a mapping diagram to represent the points below.
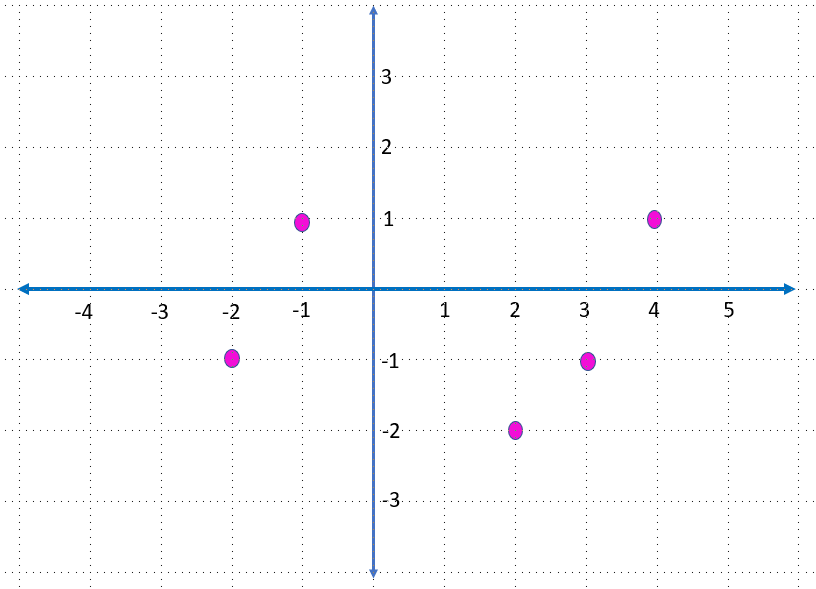
Solution
The coordinates of the points in the given figure above are listed below:
{ ( -2 , -1 ), ( -1, 1) , ( 2, -2 ), ( 3, -1 ), ( 4, 1 ) }
If we write these ordered pairs in table values, we have,
| X | Y |
| -2 | -1 |
| -1 | 1 |
| 2 | -2 |
| 3 | -1 |
| 4 | 1 |
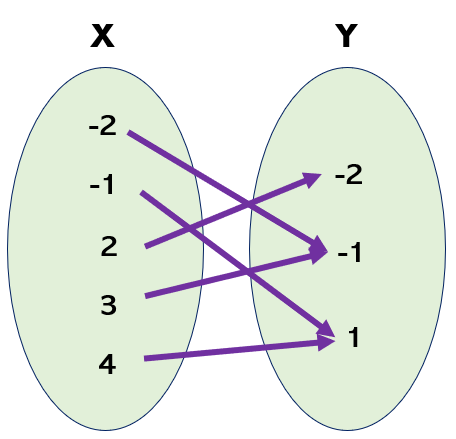
The figure below shows the mapping diagram for the given above. Take note that only one listing is required for each value that appears more than once in either column, and multiple arrows can be used to signify that duplication.
Summary
Mapping Diagram
A mapping diagram has two columns, one of which designates a function’s domain and the other its range. To show the relationship between two items, arrows or lines are drawn between the domain and the range.
Steps in Creating a Mapping Diagram
The following are the easy steps to creating a mapping diagram.
Step 1: Create two circles or ovals next to one another.
Step 2: List every input value in the circle or oval.
Step 3: List every output value in the right circle or oval.
Step 4: Connect each input value to its corresponding output value with an arrow, and repeat the process until all pairs have been matched.
Relations and Functions
Functions are relations that link one set of inputs to another set of outputs. In contrast, relations are a group of ordered pairings connecting one set of objects to another set of objects. As a result, all relations are not functions, and all functions are relations.
Mapping Diagram Relations
| One-to-one Mapping One-to-one mapping is a function in which each element of the range is associated with exactly one domain element. One-to-one relations are functions. | One-to-Many Mapping A one-to-many relation exists when one element in the domain is mapped to multiple elements in the range. Functions are not one-to-many relations. |
| Many-to-one Mapping If one or more items in the range have mapped more than one element in the domain, this is referred to as a many-to-one mapping. Many-to-one relations are functions. | Many-to-many Mapping A many-to-many relation exists when multiple elements in the domain are mapped to multiple elements in the range. Functions are not many-to-many relations. |
Frequently Asked Questions on Mapping Diagrams (FAQs)
What is shown in a mapping diagram?
The pairing of the elements is shown in the mapping diagram. It represents the input and output values of a function like a flowchart. A function’s range is represented by the other column, whereas the first column represents the domain. To depict the relationship between any two elements, lines or arrows are drawn from the domain to the range.
An example of a mapping diagram that illustrates the relationship between the elements of input values and the elements of output values is shown in the picture below.
What distinguishes a relation from a function?
Functions are relations that link one set of inputs to another set of outputs. In contrast, relations are a group of ordered pairings connecting one set of objects to another set of objects. As a result, all relations are not functions, and all functions are relations.
One-to-one and many-to-one relations are examples of functions.
How to draw a mapping diagram?
The following are the easy steps to creating a mapping diagram.
Step 1: Create two circles or ovals next to one another.
Step 2: List every input value in the circle or oval.
Step 3: List every output value in the right circle or oval.
Step 4: Connect each input value to its corresponding output value with an arrow, and repeat the process until all pairs have been matched.
Furthermore, only one listing is required for each value that appears more than once in either circle or oval, and multiple arrows can be used to signify that duplication.
A mapping diagram is illustrated in the figure below.

How to identify if a mapping diagram is a function?
The mapping diagram is a function if each input value is paired with only one output value.
The mapping diagrams below are both functions. You will see from the diagrams that no two input value elements are associated with output value elements.

How to determine the domain and range of a mapping diagram?
The pairing of the elements is shown in the mapping diagram. It represents the input and output values of a relationship like a flowchart. List all the values in the first column or oval to find the domain. List all the values in the second circle or oval to find the range. When listing the numbers, make sure they are written from least to greatest.
Let us use the mapping diagram as an example.
Domain: { -3 , -2, -1, 0, 1, 2 }
Range : { -2, -1, 1, 4, 8, 19 }
Moreover, the relationship shown in the above mapping diagram is a function since each input value is paired with only one output value.
Recommended Worksheets
Tape Diagrams (St. Patrick’s Day Themed) Math Worksheets
Mapping Diagram (Spring Equinox Themed) Math Worksheets
Pictogram (National Hispanic Heritage Month Themed) Math Worksheets