Introduction
Graphing functional relationships is an essential skill in mathematics, allowing students to visualize and analyze mathematical relationships between variables. This article covers the basics of graphing functional relationships, key concepts, and real-life applications. It also includes practice tests and frequently asked questions to strengthen understanding and application of the concept.
Grade Appropriateness
Graphing functional relationships is typically introduced in middle school (grades 6-8) and continues to be developed and reinforced throughout high school mathematics courses.
Math Domain
This topic falls under Algebra, which focuses on understanding, analyzing, and representing mathematical relationships, patterns, and functions.
Applicable Common Core Standards
Some relevant Common Core Standards include:
CCSS.MATH.CONTENT.8.F.B.4: Construct a function to model a linear relationship between two quantities.
CCSS.MATH.CONTENT.HSF.IF.C.7: Graph functions expressed symbolically and show key features of the graph by hand and using technology.
Definition
Graphing functional relationships involves representing a mathematical function with a graph, which visually represents the relationship between two variables (typically, x and y).
Key Concepts
Function: A relationship between two variables where each input value has a single output value.
Independent variable: The input variable, typically represented as x.
Dependent variable: The output variable, typically represented as y.
Cartesian coordinate system: A two-dimensional plane with x and y axes used to graph functional relationships.
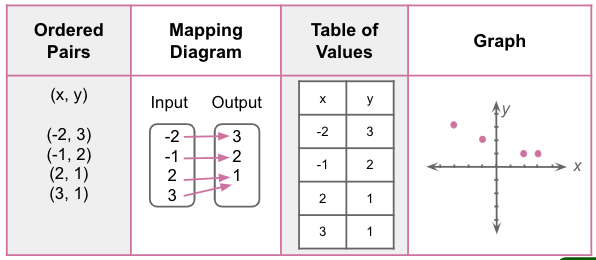
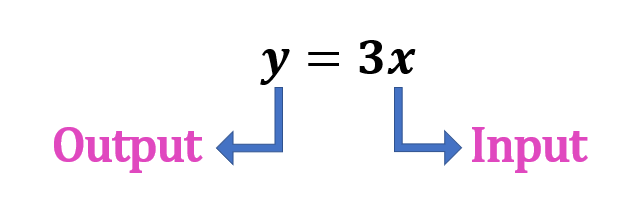
Ordered Pair: A pair of numbers in the form of (x,y) or (input, output). The first number corresponds to the x-coordinate or as an INPUT, and the second number to the y-coordinate or as an OUTPUT.
Domain of a function: The set of all possible input values (x).
Range of a function: The set of all possible output values (y).
Discussion with Illustrative Examples
Relation
A set of ordered pairs is referred to as a relation. INPUT and OUTPUT value pairs make up a set.
Example
In the relation, {(1, 4), {-2, 6), (1, 2), (4, -3)},
The domain is {-2, 1, 4}, and the range is {-3, 2, 4, 6}.
Note that we write the same element in the domain or range once.
Ways to Represent Relations
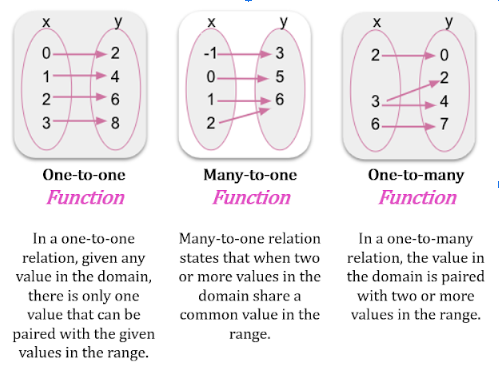
Functions
A function is a relation when each element in the domain is paired with exactly one element in the range. Although all relations are functions, not all functions are relations.
Example
Assume that the entire function is shown.
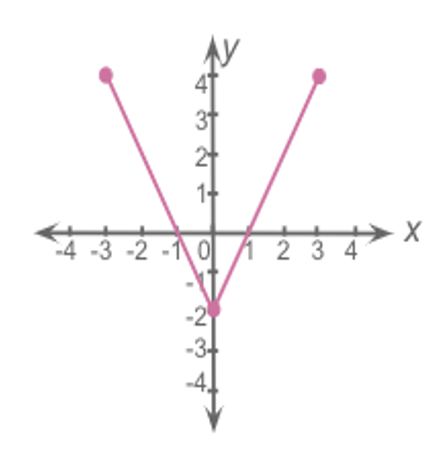
All possible values of x include all numbers from -3 to 3.
Domain: -3 ≤ x ≤ 3
All possible values of y include all numbers from -2 to 4.
Range: -2 ≤ y ≤ 4
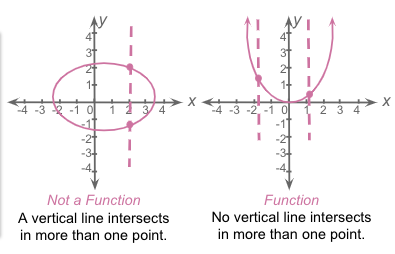
Vertical Line Test
A relation cannot be a function if a vertical line passes more than one point on its graph.
Independent and Dependent Variables
The variable (often x) whose values make up the domain is the independent variable when an equation represents a function.
The other variable (often y), whose values make up the range, is the dependent variable because its values depend on x.
Function Rule
Functions are usually represented by a function rule where you express the dependent variable, y, in terms of the independent variable, x.
Function Notation
If a relation is a function, the “y” in the equation can be replaced with f(x).
f(x) is simply a notation to represent a function. It can be read as ‘f’ of ‘x.’
The x in f(x) tells us that the value of f(x) depends on x.
Functional Relationships
A functional relationship occurs when each y-value can be paired with an x-value.
You can identify functional relationships by looking at the behavior of the graph.
Is it an increasing function? If it is, it must be rising to the right. If it rises to the left, it is a decreasing function.
You may also encounter constant functions. Its graph is neither rising to the left nor the right. It is just a horizontal line.
By looking at the trend of the values of dependent and independent variables, you may describe the functional relationship by saying, for example:
“In every increase in x, f(x) decreases by two.”
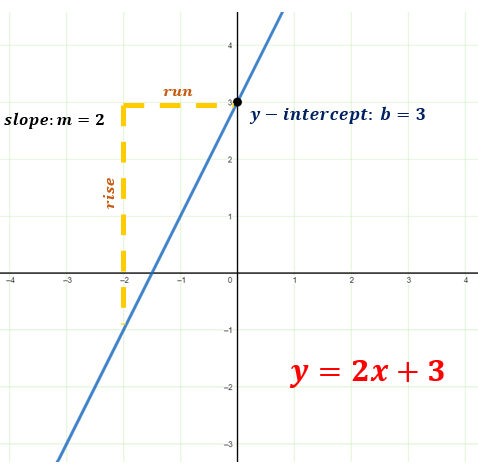
Linear Functions: Represented by the equation y = mx + b, where m denotes the slope and b is the y-intercept. A linear function has a straight line as its graph.
Example: y = 2x + 3
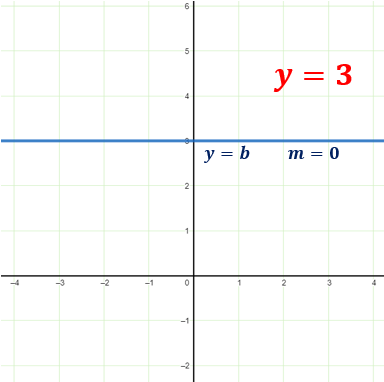
Below is a graph of a constant function where the slope does not change or m=0.
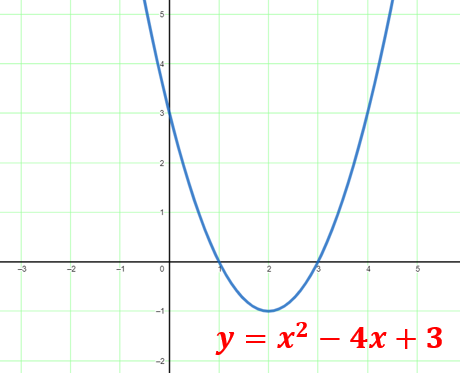
Quadratic Functions: Represented by the equation y = ax2 + bx + c, where the variables a, b, and c are constants. A parabola shows the graph of a quadratic function.
Example: y = x2– 4x + 3
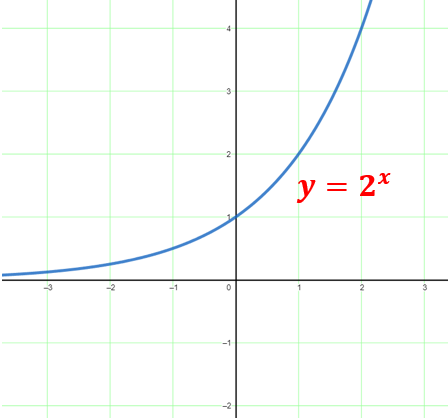
Exponential Functions: Represented by the equation y = abx , where a≠0 and b>0, b≠1. The graph of an exponential function has a curved shape that increases or decreases rapidly.
The most commonly used exponential function base is the transcendental number e, approximately equal to 2.71828.
Example: y = 2x
Examples with Solution
Example 1
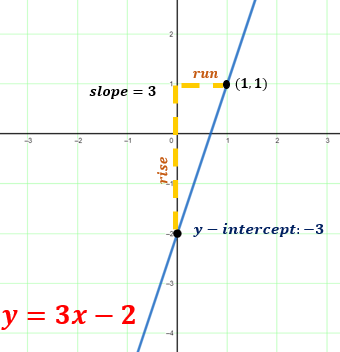
Graph the linear function y = 3x – 2.
Solution
Plot the y-intercept (0, -2), and use the slope (3) to find another point (1, 1). Draw a straight line through these points.
Example 2
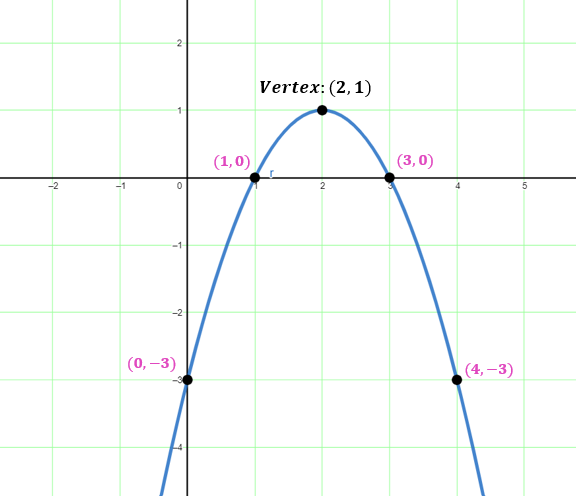
Graph the quadratic function y = -x2 + 4x – 3.
Solution: Identify the vertex using the formula x = -$\frac{b}{2a}$ , then calculate y.
x=-$\frac{4}{2(-1)}$=2
y=-( 2 )2 + 4 ( 2 ) – 3 = 1
Hence the vertex is at (2,1).
Below is the table of values to identify other points of the parabola.
| x | 0 | 1 | 3 | 4 |
| y | -3 | 0 | 0 | -3 |
Plot the vertex and other points, then draw a parabola.
Real-life Application with Solution
Problem
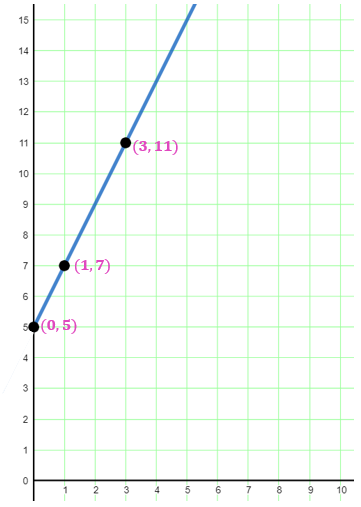
A taxi company charges a $5 flat fee plus $2 per mile. Graph the function representing the cost as a function of miles driven.
Solution
The function is y = 2x + 5, which is linear. Plot the y-intercept (0, 5), which represents the flat fee. Use the slope (2) to find another point (1, 7), representing the cost of a 1-mile ride. Draw a straight line through these points. The graph illustrates the relationship between miles driven and the total cost of a taxi ride. So, for a 3-mile ride, a taxi ride costs $11.
Problem
There were around 700,000 enslaved people in the US in 1790. Assume that the number increases by 10,000 more each year than the previous.
a. Create a function, f(x), that shows the population of enslaved people in x years after 1790, then graph.
b. Describe the functional relationship shown in the graph.
Solution
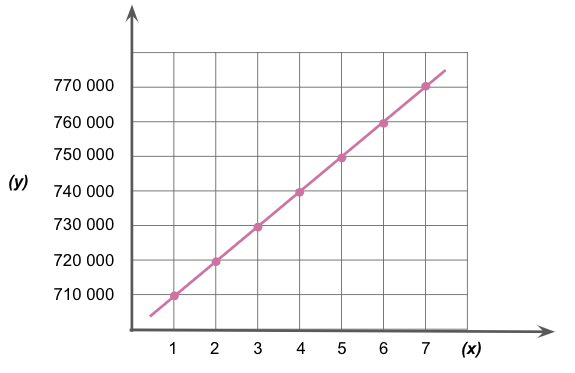
b. The graph rising to the right means that the slope is positive. As the x-value increases, the y-value increases too. Every 1 unit increase in x results in a 10,000 increase in y.
Practice Test
a. Graph the linear function y = -4x + 1.
b. Graph the quadratic function y = x2 – 6x + 8.
c. Graph the exponential function y = 3x-1.
d. Graph the function y = |x – 2|.
e. Graph the function y = ( x – 3 )2+ 2.
f. Graph the function y =$\frac{1}{x}$ .
g. Graph the function y = $\sqrt{x}$.
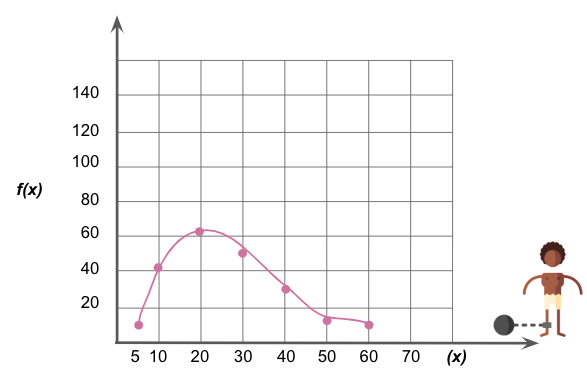
h. The graph below shows the relationship between the average price of enslaved females f(x) and their age (x) in different states along the Atlantic Coasts.
(i) Give the coordinates of the highlighted points of the graph.
(ii) Describe the functional relationship of the graph.
(iii) Provide an interpretation of the given variables.
Frequently Asked Questions (FAQs)
Can all functions be graphed?
Most functions can be graphed, but some functions may have discontinuities or undefined values that make it difficult to represent them visually.
What distinguishes a relation from a function?
A function is a particular type of relation in which each input value has exactly one corresponding output value.
How can I determine if a graph represents a function?
Use the vertical line test: if any vertical line passes through the graph at more than one point, it is not a function.
What is a piecewise function?
A piecewise function is defined by multiple sub-functions, each of which applies to a specific interval of the domain.
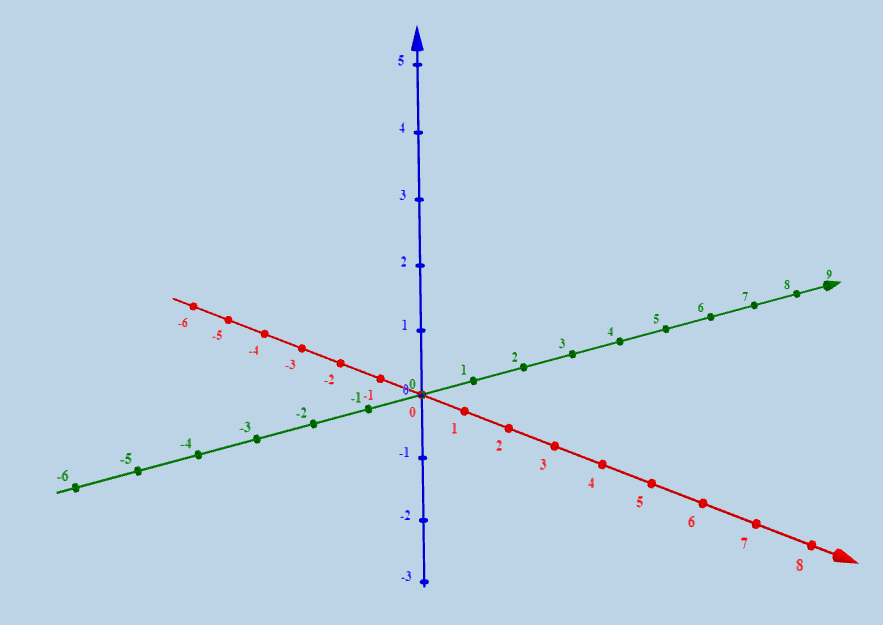
How do I graph a function with multiple variables?
Graphing functions with multiple variables require using additional dimensions. For example, a function with three variables (x, y, and z) would be represented on a three-dimensional coordinate system.
Recommended Worksheets
Graphing Functional Relationships (Black History Month Themed) Math Worksheets
Graphing Lines in Slope-Intercept Form (Famous African-Americans Themed) Math Worksheets
Understanding Basic Concepts of Relations and Functions 8th Grade Math Worksheets