Introduction
Graphing lines in slope-intercept form is a fundamental skill in mathematics, a way to visually represent linear equations and understand the relationship between two variables. We often encounter these lines in algebra and geometry, and knowing how to graph them is essential for success in these areas.
Grade Appropriateness
Understanding and graphing lines in slope-intercept form is most appropriate for students in middle school, roughly between grades 6 and 8. However, these concepts can be introduced to more advanced students in grade 5 and revisited throughout high school math courses.
Math Domain
The domain for this topic is primarily Algebra, but it also has applications in Geometry, Calculus, and even beyond in more advanced mathematical disciplines.
Applicable Common Core Standards
Here are a few of the Common Core Standards this topic addresses:
CCSS.MATH.CONTENT.8.F.B.4: Construct a function to model a linear relationship between two quantities.
CCSS.MATH.CONTENT.8.SP.A.1: Construct and interpret scatter plots for bivariate measurement data to investigate patterns of association between two quantities.
Definition of the Topic
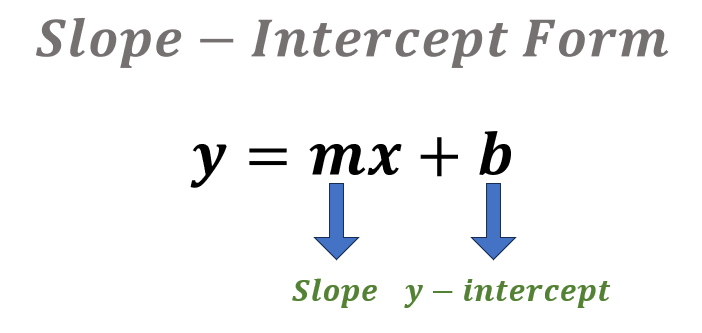
The Slope Intercept Form of a line is a way to express a linear equation. Y = mx + b is the formula for the slope-intercept form, where m denotes the slope of the line and b denotes the y-intercept (the point at which the line crosses the y-axis).
Key Concepts
Slope: The slope (m) measures how steep the line is. If the slope is positive, the line rises as it moves to the right. If the slope is negative, the line falls as it moves to the right.
Y-intercept: The point where the line crosses the y-axis is known as the y-intercept (b). It is y’s value when x is equal to 0.
Discussion with Illustrative Examples

Types of Slopes
The slope is rise over run written as a fraction. If slope (m) is a whole number, you can use one (1) as the denominator to form a fraction.
A positive slope means the line will go uphill from left to right. A negative slope means the line will go downhill from left to right. A zero slope means that the line is horizontal. An undefined slope means that the line is vertical.

y-intercept
The y-intercept (b) is where the line crosses the y-axis. The point (0, b) are the coordinates for the y-intercept.

Graphing Lines in Slope-Intercept Form
The graph of an equation in a slope-intercept form is a straight line. Lines can be horizontal, vertical, or diagonal.
The following are the steps to consider in graphing lines in slope-intercept form:
Identify the y-intercept (b) and locate the point on the y-axis.
Identify the slope (m), rise over run.
Count the rise over run from the point on the y-axis to identify another point.
Draw a line through the two points.
For example, we graph the line for the equation y =2x + 3.
The slope (m) is 2 or $\frac{2}{1}$ in fraction form, which means the line rises two units for every 1 unit it moves to the right. The y-intercept (b) is 3, so the line crosses the y-axis at the point (0,3).
We first plot the y-intercept at the point (0,3) to graph this line.

From there, we use the slope to determine where to plot the next point. We move two units up and 1 unit to the right and plot a point.

And then, we draw a line through the points.

Examples with Solutions
Example 1
Graph the line for the equation y=$\frac{2}{3}$x-4.
Solution
The slope (m) is positive $\frac{2}{3}$, meaning that the line rises two units for every three units it moves to the right. The y-intercept is at the point (0,-4) or b=-4.

Example 2
Graph the line for the equation y = -x + 2.
Solution
The slope (m) is -1 or -$\frac{1}{1}$ in fraction form. Since the slope is negative, the line falls 1 unit for every 1 unit moving to the right. The y-intercept (b) is 2, so the line crosses the y-axis at the point (0,2).
First, plot the y-intercept at (0,2), then move down 1 unit and 1 unit to the right to plot the next point.

Example 3
Graph the line for the equation y = 3x+1.
Solution
The slope (m) is positive 3, so the line rises three units for every 1 unit it moves to the right.
The y-intercept (b) is 1, so the line crosses the y-axis at the point (0,1).
Plot the y-intercept at (0,1) first, then move three units up and one unit to the right to plot the following point.

Real-life Application with Solution
Problem
John’s lemonade stand is earning money. He makes \$5 per glass sold. He already had \$10 to start. How much money does he have after selling x glasses of lemonade?
Solution
The problem can be modeled as a linear equation y = 5x + 10, where y is the total amount of money John has, and x is the number of glasses sold.
The slope (m) is 5, meaning he earns \$5 for each glass sold. The y-intercept (b) is 10, meaning he started with \$10.
If John sells four glasses of lemonade, he will have,
y = (5×4) + 10
y= 20+10
y= 30
Therefore, John will have \$30 after selling four glasses of lemonade.
Practice Test
1. Graph the line for the equation y = 4x + 1.
2. Graph the line for the equation y = -2x + 3.
3. Graph the line for the equation y = x – 1.
4. Graph the line for y = -3x – 2.
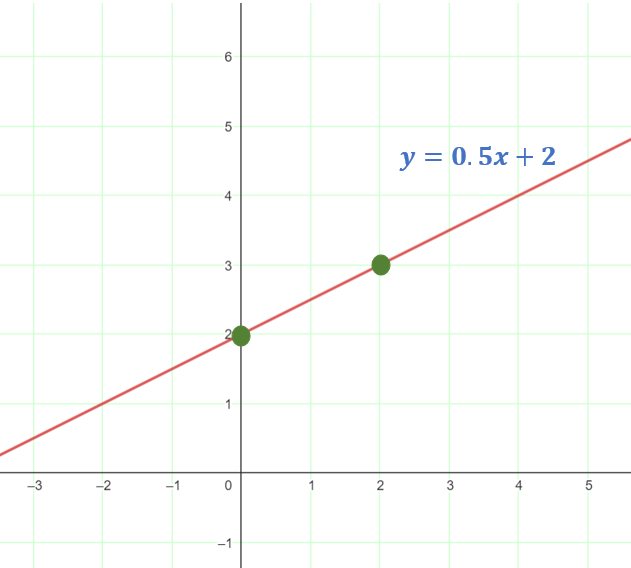
5. Graph the line for the equation y = 0.5x + 2.
Answers:
1. y = 4x + 1; m=4, b=1

2. y = -2x + 3;m=-2, y=3

3. y = x – 1;m=1, b=-1

4. y = -3x – 2;m=-3, b=-2

5. y = 0.5x + 2;m=$\frac{1}{2}$, b=2
Frequently Asked Questions (FAQs)
What if the y-intercept (b) is zero?
If the y-intercept is zero, the line crosses the y-axis at the origin (0,0).
What does a slope of zero mean?
A slope of zero means the line is horizontal. No matter what value x is, y will always be the same.
What if a linear equation does not have a y-term?
If the equation does not have a y-term, the line is vertical and has no defined slope.
What happens when the slope is undefined?
When the slope is undefined, it usually means that we have a vertical line that does not intercept the y-axis at any point other than, possibly, y = 0.
What is the relationship between the sign of the slope and the direction of the line?
If the slope is positive, the line goes up from left to right. If the slope is negative, the line goes down from left to right.
Recommended Worksheets
Graphing Lines in Slope-Intercept Form (Famous African-Americans Themed) Math Worksheets
Graphing Linear Inequalities (Civil Rights Movement Themed) Math Worksheets
Graphing Linear Equations (First African-Americans Themed) Math Worksheets