What is a straight line?
A straight line is a curve such that every point on the line segment joining any two points on it lies on it.
Let ax + by + c = 0 be a first degree equation in x, y where a, b, c are constants. Let P (x1, y1) and Q(x2, y2) be any point on the curve represented by ax+ by + c = 0. Then,
ax1 + by1 + c = 0 and ax2 + by2 + c = 0
When we say that the first degree equation is x, i.e. ax + by + c = 0 represents a line, it means that all points (x, y) satisfying ax + by + c = 0lie along a line. Thus, a line is also defined as the locus of a point satisfying the condition ax + by + c = 0, where a, b, c are constants.
It should be noted that there are only two unknowns in the equation of a straight line because the equation of every straight line can be put in the form ax + by + c = 0, where a and b are two unknowns. It is important to note here that x and y are not unknowns. In fact, these are the coordinates of any point on the line and are known as current coordinates. Thus, to determine a line we will need two coordinates to determine the two unknowns.
What are Intercepts?
Now that we have recalled what we mean by the Cartesian system, let us understand what we mean by intercepts. The intercepts of a graph are points at which the graph crosses the axes.
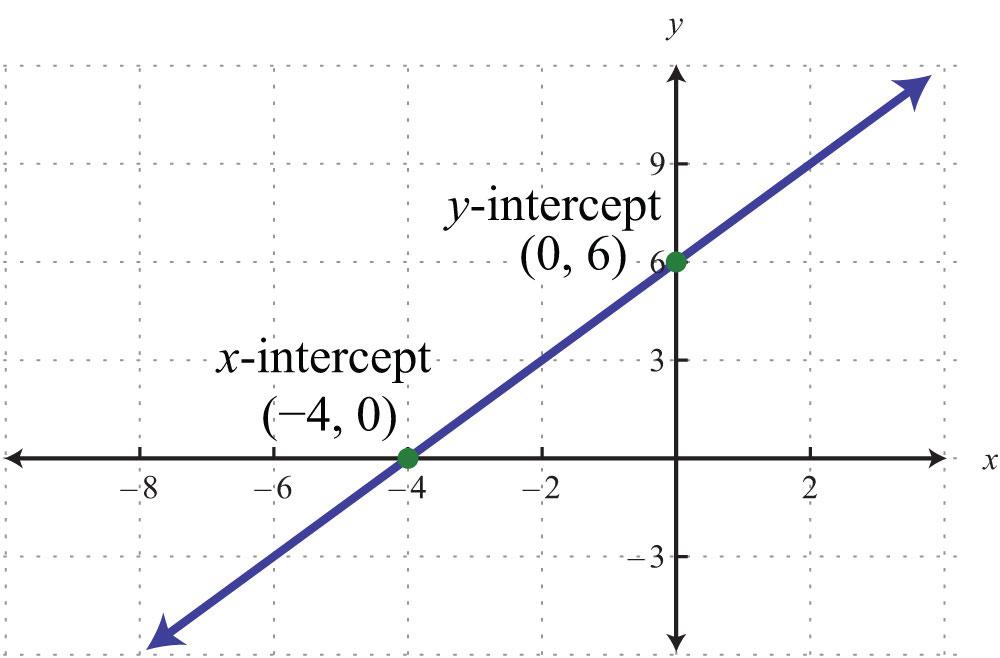
The x-intercept is defined as the point at which the graph crosses the x-axis. At this point, the y-coordinate is zero. The coordinates of the x intercept are always in the form of ( x , 0 ).
The y-intercept is the point at which the graph crosses the y-axis. At this point, the x-coordinate is zero. . The coordinates of the y intercept are always in the form of ( 0 , y ).
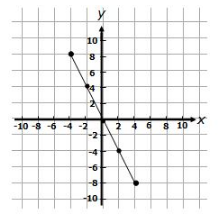
Let us understand this through an example. Suppose on a graph we wish to plot a line that passes the x axis at -4 units and the y axis at 6 units. In this case, the point on the x axis will be ( -4 , 0 ) and the point on the y-axis will be ( 0, 6 ). The points thus plotted on the graph will be as represented in the figure below –
Slope of a Line
The trigonometrical tangent of the angle that a line makes with the positive direction of the x-axis in an anticlockwise sense is called the slope or the gradient of a line.
The slope of a line is generally denoted by m. Thus m = tan
Since a line parallel to the x-axis makes an angle of 0o with the x-axis, therefore, its slope is tan 00 = 0
A line parallel to the y-axis, i.e. a line that is perpendicular to the x-axis makes an angle of 90o with the x-axis, so its slope is tan $\frac{π}{2}$ = ∞. Also, the slope of a line equally inclined with axes is 1 or -1 as it makes an angle of 45o or 135o with the x-axis.
The angle of inclination of a line with the positive direction of the x-axis in an anticlockwise sense always lies between 00 and 1800.
Let us now understand the slope using some examples.
Example
What can be said regarding a line is its slope is a) positive b) zero c) negative?
Solution
Let θ be the angle of inclination of the given line with the positive direction of the x-axis in an anticlockwise sense. Then, its slope is given by m = tan θ.
a) If the slope of the line is positive, then,
m = tan θ > 0 ⇒ θ lies between 00 and 900
This means that θ is an acute angle.
Thus the line of positive slope makes an acute angle with the parallel direction of the x-axis.
b) If the slope of a line is zero, then,
m = tan θ = 0 ⇒ θ = 00
This means that either the line is x-axis or it is parallel to the x-axis.
Thus the line of zero slope is parallel to the x-axis.
c) If the slope of the line is negative, then,
m = tan θ < 0 ⇒ θ lies between 900 and 1800
This means that θ is an obtuse angle.
Thus the line of negative slope makes an obtuse angle with the parallel direction of the x-axis in an anticlockwise direction.
Slope of a line in Terms of Coordinates of any Two Points on it
What would be the slope of a line in terms of coordinates of any two points on it? Let us find out.
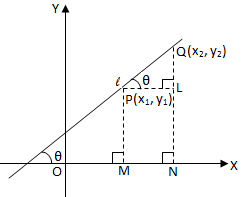
Let P(x1, y1) and Q(x2, y2) be two points on a line making an angle θ with the positive direction of the x-axis. Draw Pl, QM perpendicular on x-axis and PN_QN on QM. Then,
PN = LM = OM – OL = x2 – x1 and QN = QM – NM = QM – PL = y2 – y1
In △ PQN, we have,
tan θ = QNPN = $\frac{y_2- y_1}{x_2- x_1}$
Thus, if (x1, y1) and (x2, y2) are coordinates of any two points on a line then its slope is given by
m = $\frac{y_2- y_1}{x_2- x_1} = \frac{Difference\: in\: ordinates}{Difference\: in\: adbscissae}$
Let us understand it through an example.
Example
Find the slope of a line that passes through the points (3, 2) and (-1, 5)
Solution
We know that the slope of a line passing through two points (x1, y1) and (x2, y2) is given by
m = $\frac{y_2- y_1}{x_2- x_1}$
Here, y1 = 2, y2 = 6, x1 = 3, x2 = -1
Substituting these values in the given equation, we have
m = $\frac{5-2}{-1-3} = \frac{-3}{4}$
Hence, the slope of a line that passes through the points (3, 2) and (-1, 5) is $\frac{-3}{4}$
Point- Slope Form
The equation of a straight line can be written in different forms depending on the data give. One of such forms is the point-slope form. The point-slope form includes the slope of the straight line and a point on the line as the name suggests. There can be infinite lines with a given slope, but when we specify that the line passes through a given point then we get a unique straight line. Thus, only a point on the line and its slope are required to represent a straight line in the point-slope form. Let us now understand what is a point-slope form?
The theorem of the point-slope form states that –
The equation of a line that passes through the point (x1, y1) and has the slope “m” is given by y – y1 = m (x – x1)
How did we reach upon this formula? Let us check out.
Let the straight line passing through the point Q(x1, y1) and let P (x, y) be any point on the line.
Then, we know that the Slope of a line = $\frac{y-y_1}{x-x_1}$
But, we also know that the slope of the line is “m”
Therefore,
m = $\frac{y-y_1}{x-x_1}$
⇒ y-y1 = m (x-x1)
Hence, y-y1 = m (x-x1) is the required equation of the line.
Using “Rise and Run” to find the Slope of a Line
The slope of a line is calculated by dividing the rise by the run. The “rise” and the “run” can be found using any two points on the line as shown in the examples below.
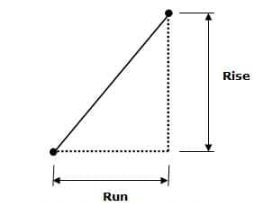
Slope ( m) = $\frac{Rise}{Run}$
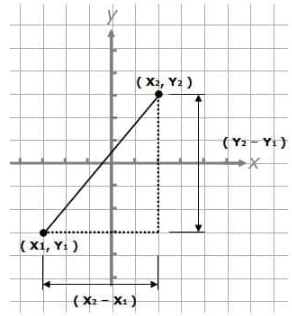
Let us consider the same on an x – y axis. In this case the rise would equal the difference in the y –coordinates while the run would equal the difference in the x –coordinates.
Let ( x1, y1 ) and ( x2, y2 ) be the coordinates of a line on the x-y axis. Then
Rise = y2 – y1
Run = x2 – x1
So, the formula of the slope of a line would be
Slope ( m ) = $\frac{y_2- y_1}{x_2- x_1}$
Below we have the graphical representation of the same-
Let us understand it through an example
Example
Calculate the slope of the line using the two sets of coordinates, ( 2, 5 ) and ( – 2, – 3 )
Solution
We have been given the coordinates, ( 2, 5 ) and ( – 2, – 3 ) and we are required to find the slope of this line.
Below is the graphical representation of the line –
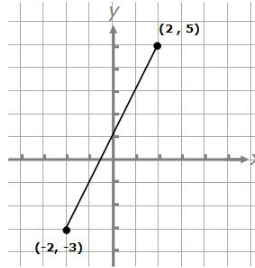
We know that Slope ( m ) = $\frac{y_2- y_1}{x_2- x_1}$
Substituting the given values in the formula above, we have
Slope ( m ) = $\frac{5-( -3 )}{2-( -2 )} = \frac{5+3}{2+2} = \frac{8}{4}$ = 2
It is important to note here that it does not matter which pair of coordinates we call ( x1, y1 ) and which pair we call (x2, y2 ) as long as we use the same order when subtracting to find the rise as we do when subtracting to find the run. For the equation of a line, y = mx, the value m represents the slope. The slope (m) of the line that is generated can be given as a positive or negative number which shows its steepness and direction. The four examples below show the slope for different linear functions. These functions are shown in algebraic, tabular, and graphical form-
Upward Positive Slope
Consider the equation y = 3 x
Let us solve this equation for some values of x and plot it on a graph. We will have
| x : | 0 | 1 | 2 | 3 | 4 |
| y : | 0 | 3 | 6 | 9 | 12 |
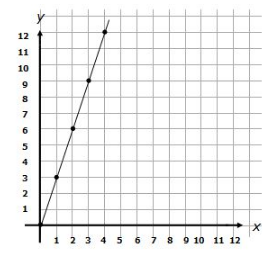
The slope of the line above is 3. The value of y increases 3 times as much as does the value of x.
Let us now consider the equation y = $\frac{x}{2}$
Let us solve this equation for some values of x and plot it on a graph. We will have
| x : | 0 | 2 | 4 | 6 | 8 |
| y : | 0 | 1 | 2 | 3 | 4 |
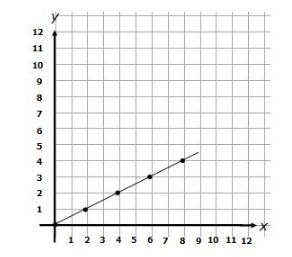
In both the examples above, the line slopes upward from left to right. These are positive slopes or positive rates of change. As x increases, y also increases.
Downward Negative Slope
Consider the equation y = – x
Let us solve this equation for some values of x and plot it on a graph. We will have
| x : | 0 | 2 | 4 | 6 | 8 |
| y : | 0 | 2 | 4 | 6 | 8 |
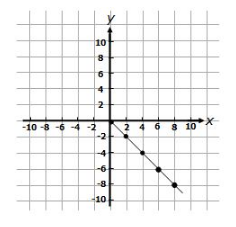
Let us now consider the equation y = – 2 x
Let us solve this equation for some values of x and plot it on a graph. We will have
| x : | 4 | 2 | 0 | 2 | 4 |
| y : | 8 | 4 | 0 | 4 | 8 |
Note the slopes of the two examples above. They show that, as x increases, y decreases. This results in a negative slope that runs downwards from left to right
Rate of Change
The rate of change tells us how one quantity changes as the other changes. In the examples above the slope of the line corresponds to the rate of change, for instance in an x-y graph, a slope of 2 means that y increases by 2 for every increase of 1 in x. The examples below show how the slope shows the rate of change using real-life examples in place of just numbers.
Example 1
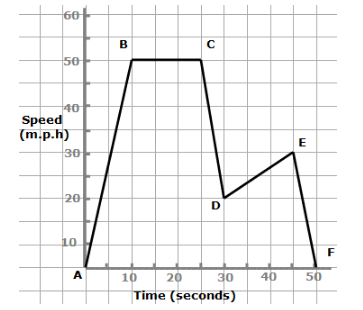
The graph below shows the speed of a vehicle plotted against time. Look at the different slopes – both the steepness and direction. These represent the rate of change of speed otherwise known as acceleration.
What is happening?
A – B: Starts from a stationary position and increases speed up to 50 m.p.h after 10 seconds.
B – C: Traveling at a constant 50 m.p.h. for 15 seconds.
D – E: Speeding up from 20 to 30 m.p.h. over 15 seconds.
E – F: Slowing down and stopping over 5 seconds.
Example 2
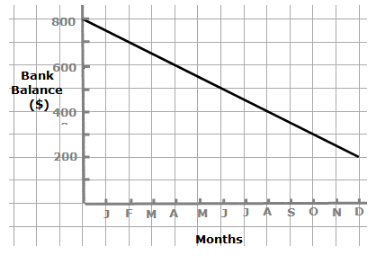
Michelle has a bank account she uses for just one thing – paying 50 every month to her favorite charity. The bank account has 800 in it at the beginning of the year.
The slope of the graph below shows the rate of change in the bank balance. The slope is -50 which corresponds to the $50 per month that is coming out of the account.
Comparing the rate of change
Look at the slope in the example below and compare it to Example 2 above. Which slope is steepest? Which shows the greatest rate of change?
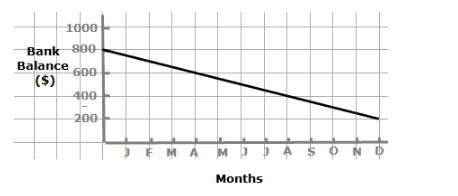
Both graphs show a decline of $50 per month. They both show the same rate of change. It is only the difference in scale of the y-axis that makes Example 2 appear steeper. Sometimes people wish to emphasize or de-emphasize rates of change (e.g. employment rates, change of price) and they can try to do so by choosing whatever scale they like for the axes of the graphs.
Solved Examples
Example 1 Find the equation of the straight line with slope -2 and passing through (7, -4).
Solution We have been given that the slope of the line is 2 or m = -2 and the line passes through ( 7, -4 ),
We have also been given that (x1, y1) = ( 7, -4) . This means that x1 = 7 and y1 = -4
Now, we know that the equation of the line in point-slope form is
y-y1 = m (x-x1)
Substituting the given values in the above equation, we have
Therefore, the required equation of the straight line is
y-( -4 ) = -2 ( x-7)
y + 4 = -2x + 14
⇒ 2x – y + 10 = 0
Hence, the equation of the straight line with slope -2 and passing through (7, -4) is 2x – y + 10 = 0
Example 2 Find the equation of the straight line with slope 3 and passing through (-1, 5).
Solution We have been given that the slope of the line is 3 or m = 3 and the line passes through (-1, 5),
We have also been given that (x1, y1) = (-1, 5). This means that x1 = -1 and y1 = 5
Now, we know that the equation of the line in point-slope forms I
y-y1 = m (x-x1)
Substituting the given values in the above equation, we have
Therefore, the required equation of the straight line is
y-5 = 3 (x-( -1 ))
y – 5 = 3 ( x + 1 )
y – 5 = 3x + 3
⇒ 3x – y + 8 = 0
Hence, the equation of the straight line with slope 3 and passing through (-1, 5) will be given by 3x – y + 8 = 0
Key Facts and Summary
Recommended Worksheets
- A straight line is a curve such that every point on the line segment joining any two points on it lies on it.
- The x-intercept is defined as the point at which the graph crosses the x-axis. At this point, the y-coordinate is zero. The coordinates of the x intercept are always in the form of (x , 0 ).
- The y-intercept is the point at which the graph crosses the y-axis. At this point, the x-coordinate is zero. . The coordinates of the y intercept are always in the form of ( 0 , y ).
- To determine a line we will need two coordinates to determine the two unknowns.
- The trigonometrical tangent of the angle that a line makes with the positive direction of the x-axis in an anticlockwise sense is called the slope or the gradient of a line.
- The slope of a line is generally denoted by m. Thus m = tan
- The equation of a line that passes through the point (x1, y1) and has the slope “m” is given by y – y1 = m (x – x1)
- Thus the line of positive slope makes an acute angle with the parallel direction of the x-axis.
- Thus the line of negative slope makes an obtuse angle with the parallel direction of the x-axis in an anticlockwise direction.
- Thus the line of zero slope is parallel to the x-axis
- The rate of change tells us how one quantity changes as the other changes.
Graphing Lines in Slope-Intercept Form (Famous African-Americans Themed) Math Worksheets
Graphing Proportional Relationships and Identifying Slope of the Line 8th Grade Math Worksheets
Points and Lines (Stationery Themed) Worksheets