Introduction
Various types of information are collected when gathering data depending on what you want to investigate or understand. Knowing your data type is vital when collecting data or conducting data analysis. Your dataset will contain a wide range of variables, each of which can be recorded with varying degrees of accuracy.
Statisticians utilize data to answer questions in a compelling manner. In statistics, a classification known as the level of measurement is used to relate the values assigned to variables.
Nominal, ordinal, ratio and interval are the four types of measurements; however, ordinal data is the main topic of this article. The concept, usage examples, gathering, and analysis of ordinal data will all be covered in this post.
What is ordinal data?
Definition
Ordinal data in statistics are the kind of data where the values are arranged naturally. The fact that the differences between the data values cannot be determined is one of the most noticeable characteristics of ordinal data.
Variables with a natural order but no quantitative difference in values are labeled using the ordinal data. Ordinal data are a higher degree of measurement since they provide more information than nominal data.
Examples of ordinal data
The following are some instances of variables that can be measured using ordinal data:
| Degree of Pain | Minimal, Moderate, Severe, Unbearable Pain |
| Education Level | Elementary, High School, College Graduate |
| Customer Level Satisfaction | Not Satisfied, Slightly Satisfied, Satisfied, Very Satisfied, Extremely Satisfied |
| Economic Status | Low, Medium, High |
| Military Rankings | Lieutenant, Captain, Major, Colonel, General |
| Expertise | Beginner, Intermediate, Expert |
| Agreement Level | Strongly Disagree, Disagree, Neutral, Agree, Strongly Agree |
Characteristics of Ordinal Data
The ordinal data have the following characteristics.
( a ) Natural order appears in ordinal data. Let us take the classification of pain by the intensity in the following order: excruciating, severe, moderate, and minimum.
( b ) It is unknown what the interval’s characteristics are. It is impossible to quantify the value difference. Let us say, for example, that we cannot say that the difference between the degree of pain, minimal and moderate, is the exact difference between severe and excruciating.
( c ) Ordinal data allow for median and mode computation. The median is the middle of the data set, while the mode is the category that occurred most frequently.
Comparison to other Levels of Measurement
There are four types of measurement: nominal, ordinal, ratio, and ordinal.
The table below shows the characteristics, central tendency measures, and examples of each measurement level.
| Levels of Measurement | Characteristics | Central Tendency Measure | Examples |
| Nominal | Categories | Mode | Gender, Blood Type, Hair Color, Marital Status |
| Ordinal | Rankings | Median and Mode | Levels of Pain, Customer Level Satisfaction |
| Interval | Differences between measurements (no true zero) | Mean, Median, and Mode | Temperature (Celsius or Fahrenheit) Personal InventoriesTest Scores |
| Ratio | Differences between measurements and true zero exist | Mean, Median, and Mode | Age, Height, Weight |
Uses of Ordinal Data
Ordinal data are frequently used in a variety of questionnaires and surveys. One example is the Likert data, which may be found in many surveys. The Likert data includes psychometric data categories like Strongly Agree, Agree, Undecided, etc.
Ordinal data are also frequently used to gather demographic data. This is very frequent in industries like finance, marketing, and insurance, but it’s also used by the government, such as during the census.
This data type is frequently used in several fields in finance and economics. Consider an economic study that compares the GDP levels of several nations. The rankings are an example of ordinal data if the report ranks the nations according to their GDP figures.
How to collect ordinal data?
Ordinal data are typically gathered using questionnaires or surveys. Ordinal data can be gathered from any inquiry that rates responses on an explicitly or implicitly scale.
Ordinal variables are typically evaluated using closed-ended survey questions that offer respondents a range of possible responses. These are simple to use and make it simple to compare participant data.
Likert Data
The Likert data is frequently used to collect ordinal data. Likert data are made up of four or more Likert-type questions that offer participants a range of possible answers.
The following are examples of Likert-data questions:
( a ) What would you say is the level of service quality?
Poor Fair Neutral Very Good Excellent
( b ) How important is your mobile phone to you?
Extremely Unimportant Somewhat Unimportant Not sure
Somewhat Important Extremely Important
These values are sometimes encoded into numerical values since they follow a natural order. Let’s use the following data: 1 represents poor, 2 fair, 3 neutral, 4 very good, and 5 excellent.
The fact that not all mathematical operations can be carried out on these numbers must be kept in mind. In spite of this, you can state if two values in your data collection are equal or unequal or whether one number is bigger or lower than another. The values cannot be added to or subtracted from one another in any logical way.
How to Analyze Ordinal Data?
Utilizing visualization tools is the most straightforward approach to studying ordinal data. For instance, the information might be displayed as a table where each row denotes a different category. Additionally, they can be represented graphically using a variety of charts. The bar chart is the most widely used for displaying this data.
Advanced statistical analysis tools like hypothesis testing can also be used to analyze ordinal data. Note that these kinds of data do not lend themselves to traditional parametric procedures like the t-test or ANOVA.
Descriptive Statistics for Ordinal Data
Descriptive statistics may be used to analyze ordinal data like frequency distribution, mode and median, and range. The central tendency, like median and mode, can be calculated where the median is the middle value while the mode is the variable that occurs most frequently. The range is used with ordinal data to indicate variability.
Let us say, for example, 25 survey participants were asked to answer this question.
Problem-based learning is more complex than traditional learning.
Strongly Disagree Disagree Neutral Agree Strongly Agree
Frequency Distribution Table
The frequency distribution below displays the number of times each response was chosen. The percentage of each response is displayed in the third column.
| Response | Frequency | Percentage |
| Strongly Disagree | 1 | 4% |
| Disagree | 2 | 8% |
| Neutral | 4 | 16% |
| Agree | 6 | 24% |
| Strongly Agree | 12 | 48% |
| Total | 25 | 100% |
To visualize the data, we can use a bar graph to show the frequency or a pie chart to show the percentage.
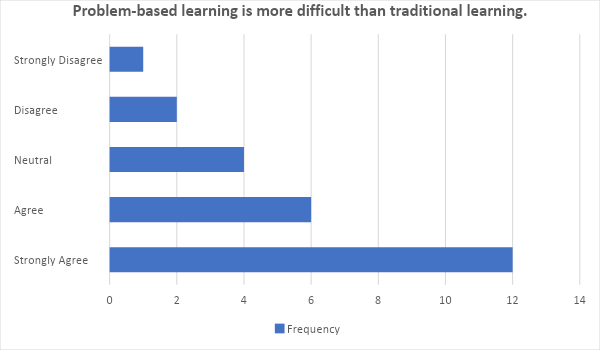
The bar graph illustrates that 12 survey respondents selected strongly agree, 6 selected agree, 4 selected neutral, 2 selected disagree, and 1 selected strongly disagree.
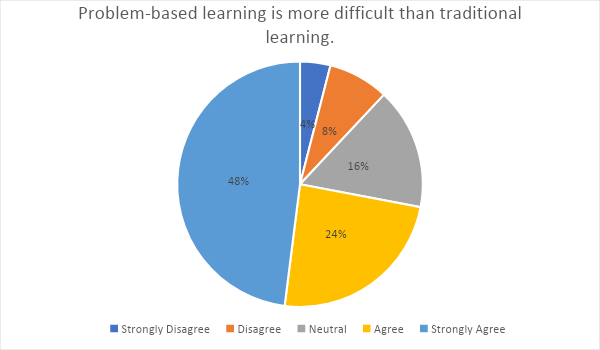
According to the pie chart, 48% of survey respondents selected strongly agree, 24% selected agree, 16% selected neutral, 8% selected disagree, and 4% chose strongly disagree.
Median and Mode
The mode, mean, and median are the three most popular central tendency measures.
Ordinal data cannot be used to compute the mean. You must conduct arithmetic operations like addition and division on the values in the data set to get the mean. These processes involved in getting the mean cannot be carried out to provide meaningful results with ordinal data since the differences between adjacent scores are unknown. The mode can typically be identified for ordinal data, but the median is not always the case.
Let us use again the frequency distribution table below as an example.
| Response | Frequency | Percentage |
| Strongly Disagree | 1 | 4% |
| Disagree | 2 | 8% |
| Neutral | 4 | 16% |
| Agree | 6 | 24% |
| Strongly Agree | 12 | 48% |
| Total | 25 | 100% |
The mode is the data that occurred most frequently in the data set. In the presented frequency distribution table, the mode is Strongly Agree since it has the highest number of responses.
Different methods are used to find the medians for data sets with odd and even numbers. The value in the middle of the data set when it is ranked in an odd-numbered data set is the median. The median of an even-numbered data set is the mean of the two values that are located in the center of the data set.
Variability
The minimum, maximum, and range can be found to evaluate the variability of the data collected. To use them, the data must be numerically coded.
For example, let us have the numerical codes below:
1: Strongly Disagree
2: Disagree
3: Neutral
4: Agree
5: Strongly Agree
Look for the lowest and highest numbers that appear in your data set to determine the minimum and maximum. 1 is the minimum, and 5 is the maximum. Subtract the minimum from the maximum to get the range: Range = 5 – 1 = 4
Inferential Statistics for Ordinal Data
We can summarize data using descriptive statistics, while we require inferential statistics to obtain more general conclusions. Testing hypotheses and making inferences based on our findings is how inferential statistics function. We can accomplish this using one of two main types of approaches. Non-parametric and parametric tests. We are limited to non-parametric methods like ordinal and nominal data for qualitative data types.
The following non-parametric techniques may be used with ordinal data:
Mood’s median test
You can compare medians from two or more sample populations using The Mood’s median test to see how unlikely they are from one another.
Spearman’s rank correlation coefficient
With the help of Spearman’s rank correlation coefficient, we can investigate potential connections or correlations between two ordinal variables. It measures, specifically, the statistical correlation between the rankings of various variables.
The Mann-Whitney U test
You can determine whether two samples are drawn from the same population using the Mann-Whitney U test. Additionally, it can be used to determine whether or not observations from one sample group have a tendency to be greater than those from a different sample.
The Kruskal-Wallis H test
Using the Kruskal-Wallis H test, we can compare the mean ranking of scores across three independent data samples. The Mann-Whitney U test is extended in this case by using more samples than the standard Mann-Whitney U test allows. Sample sizes for the Kruskal-Wallis H test can be the same or different. It will enable us to ascertain whether the samples come from the same distribution.
Wilcoxon signed-rank test
The Wilcoxon signed-rank test compares how and to what extent the mean rank of two populations differs by examining the distribution of scores in two dependent data samples. The results of this test will indicate if two samples were taken from populations with an equal distribution or whether there is a statistically significant difference between them.
Summary
Definition
Ordinal data in statistics are the kind of data where the values are arranged naturally. The fact that the differences between the data values cannot be determined is one of the most noticeable characteristics of ordinal data.
Variables with a natural order but no quantitative difference in values are labeled using the ordinal data. Ordinal data are a higher degree of measurement since they provide more information than nominal data.
Characteristics of Ordinal Data
The ordinal data have the following characteristics.
( a ) Natural order appears in ordinal data. Let us take the classification of pain by the intensity in the following order: excruciating, severe, moderate, and minimum.
( b ) It is unknown what the interval’s characteristics are. It is impossible to quantify the value difference. Let us say, for example, that we cannot say that the difference between the degree of pain, minimal and moderate, is the exact difference between severe and excruciating.
( c ) Ordinal data allow for median and mode computation. The median is the middle of the data set, while the mode is the category that occurred most frequently.
Descriptive Statistics for Ordinal Data
The following are descriptive statistics that may be used for ordinal data:
Inferential Statistics for Ordinal Data
The following non-parametric techniques may be used with ordinal data:
Mood’s median test
Spearman’s rank correlation coefficient
The Mann-Whitney U test
The Kruskal-Wallis H test
Wilcoxon signed-rank test
Frequently Asked Questions on Ordinal Data (FAQs)
What are the four levels of measurement?
The level of measurement is a classification used in statistics that links the values given to variables with one another. In other words, the information contained in the values is described using the level of measurement.
Nominal, ordinal, interval and ratio are the four different levels of measurement.
What distinguishes nominal data from ordinal data?
Nominal data, commonly referred to as nominal scale, is a type of data that is used in statistics to name variables without providing any numeric value. Data that may be labeled or categorized into groups that cannot coexist is known as nominal data. No logical arrangement of these categories is possible. Its scale of measurement is in its most basic form.
Some examples of nominal data include gender, blood type, hair color, eye color, marital status, modes of transportation, etc.
Ordinal data in statistics are the kind of data where the values are arranged naturally. The fact that the differences between the data values cannot be determined is one of the most noticeable characteristics of ordinal data.
Variables with a natural order but no quantitative difference in values are labeled using the ordinal data. Ordinal data are a higher degree of measurement since they provide more information than nominal data.
What are some examples of ordinal data?
The following are some examples of variables that can be measured using ordinal data:
| Degree of Pain | Minimal, Moderate, Severe, Unbearable Pain |
| Education Level | Elementary, High School, College Graduate |
| Customer Level Satisfaction | Not Satisfied, Slightly Satisfied, Satisfied, Very Satisfied, Extremely Satisfied |
| Economic Status | Low, Medium, High |
| Military Rankings | Lieutenant, Captain, Major, Colonel, General |
| Grades | A+, A-, B+, B-, C |
| Economic Status | Underclass, Working Poor, Working Class, Lower Middle Class, Upper Middle Class, Upper Class |
How to visualize ordinal data?
Pie charts and bar charts are the ways to visualize ordinal data because the only descriptive statistics you can perform on it are frequencies, proportions, and percentages.
How is descriptive statistics used to analyze ordinal data?
Descriptive statistics may be used to analyze ordinal data like frequency distribution, mode and median, and range. The central tendency, like median and mode, can be calculated where the median is the middle value while the mode is the variable that occurs most frequently. The range is used with ordinal data to indicate variability.
How is inferential statistics used to analyze ordinal data?
We can summarize data using descriptive statistics, while we require inferential statistics to obtain more general conclusions. Testing hypotheses and making inferences based on our findings is how inferential statistics function. We can accomplish this using one of two main types of approaches. Non-parametric and parametric tests. We are limited to using non-parametric methods for qualitative data types like ordinal and nominal data.
The following non-parametric techniques may be used with ordinal data:
Mood’s median test
You can compare medians from two or more sample populations using The Mood’s median test to see how unlikely they are from one another.
Spearman’s rank correlation coefficient
With the help of Spearman’s rank correlation coefficient, we can investigate potential connections or correlations between two ordinal variables. It measures, specifically, the statistical correlation between the rankings of various variables.
The Mann-Whitney U test
You can determine whether two samples are drawn from the same population using the Mann-Whitney U test. Additionally, it can be used to determine whether or not observations from one sample group have a tendency to be greater than those from a different sample.
The Kruskal-Wallis H test
Using the Kruskal-Wallis H test, we can compare the mean ranking of scores across three independent data samples. The Mann-Whitney U test is extended in this case by using more samples than the standard Mann-Whitney U test allows. Sample sizes for the Kruskal-Wallis H test can be the same or different. It will enable us to ascertain whether the samples come from the same distribution.
Wilcoxon signed-rank test
The Wilcoxon signed-rank test compares how and to what extent the mean rank of two populations differs by examining the distribution of scores in two dependent data samples. The results of this test will indicate if two samples were taken from populations with an equal distribution or whether there is a statistically significant difference between them.
How is ordinal data different from the other levels of measurement?
There are four types of measurement: nominal, ordinal, ratio, and ordinal.
The table below shows the characteristics, central tendency measures, and examples of each measurement level.
| Levels of Measurement | Characteristics | Central Tendency Measure | Examples |
| Nominal | Categories | Mode | Gender, Blood Type, Hair Color, Marital Status |
| Ordinal | Rankings | Median and Mode | Levels of Pain, Customer Level Satisfaction |
| Interval | Differences between measurements (no true zero) | Mean, Median, and Mode | Temperature (Celsius or Fahrenheit) Personal InventoriesTest Scores |
| Ratio | Differences between measurements and true zero exist | Mean, Median, and Mode | Age, Height, Weight |
The least amount of information is included in nominal scales. A nominal scale is the most basic measurement system we may use to name variables. Variables without quantitative values are labeled using a nominal scale. A nominal scale is a naming scale where variables are merely “named” or labeled with no particular order.
Variables with a natural order but no quantitative difference in values are labeled using the ordinal scale. Ordinal scales are a higher degree of measurement since they provide more information than nominal scales.
Variables with the natural order, measurable differences between values, but no true zero value are characterized by interval scale. Because they guarantee that there are no significant differences between values, interval scales provide more information than ordinal scales. In other words, interval scales are ordinal scales with equivalent scale values across the range of intervals from low to high.
The definition of a ratio scale is a variable measurement scale that not only determines the order of the variables but also reveals the differences between them and provides information on the value of true zero. It is determined by making the assumptions that each variable has a zero choice, that the difference between each variable is the same, and that the options are in a particular order.
Recommended Worksheets
Data (World War II Themed) Math Worksheets
Nominal and Ordinal Data (Winter Solstice Themed) Math Worksheets
Discrete and Continuous Data (Spring Equinox Themed) Math Worksheets