Mean
Definition of Mean
The mean, also known as the “Arithmetic Mean” of a group of observations is the value that is equally shared out among all the observations. In simple terms, it is the average of a set of numbers.
Examples of Mean
We use mean in referring to many values in our everyday lives.
For example,
We usually say that the average number of runs scored by a player in this match was 20.
My average score in the exam was 65.
Symbol of Mean
The symbol of mean is x̄.
Mean formula
The mean of a set of observations is calculated depending upon the group of numbers we have, i.e. whether the numbers whose means if to be determined are present in a grouped form or ungrouped form.
Mean of Ungrouped Data
Ungrouped data refers to the data where the numbers are present in a simple manner, with each value defined separately. The arithmetic mean of ungrouped data is defined as
Arithmetic Mean = $\frac{Sum\, of\, all\, observations}{Number\, of\, observations}$
Thus, if x1, x2, x3, ….…. xn are the values of n observations then the arithmetic mean of these observations is given by
Arithmetic Mean = $\frac{x_1+ x_2+ x_3 + …+ x_n}{n}$
Example
If the heights of 5 persons are 144 cm, 152 cm, 151 cm, 158 cm and 155 cm respectively. Find the mean height.
Solution
We have been given that the heights of 5 persons are 144 cm, 152 cm, 151 cm, 158 cm and 155 cm respectively.
The observations, in this case, are – 144 cm, 152 cm, 151 cm, 158 cm and 155 cm
Total number of observations = 5
To calculate the mean first we need to find the sum of all the observations.
Therefore,
(144 + 152 + 151 + 158 + 155) cm = 760 cm
Now, according to the formula of the mean,
Arithmetic Mean = $\frac{Sum\, of\, all\, observations}{Number\, of\, observations}$
Therefore,
Arithmetic Mean = 760/5 cm = 152 cm
Hence, the mean height of the 5 persons = 152 cm
Mean of Grouped Data
In the case of larger observations, data can be presented in the form of a frequency table that exhibits the values taken by the variable and the corresponding frequencies. This form of data is called grouped data or discrete frequency distribution.
If x1, x2, x3, ….…. xn are n values of a variable with corresponding frequencies f1, f2, f3,………… fn respectively, then the arithmetic mean of these values is defined by
Mean = $\frac{f_1 x_1+ f_2 x_2+ f_3 x_3+ …+.f_n x_n}{f_1+ f_2+ f_3 + …+f_n}$
Or
Mean = $\frac{\sum f_i x_i }{\sum f_i}$
where ∑ is called sigma which is a Greek letter that represents the summation.
The following steps are involved in order to compute the arithmetic mean of grouped data –
Step1 Prepare a frequency table in such a way that its first column consists of the values of the variate and the second column the corresponding frequencies.
Step 2 Multiply the frequency of each row with the corresponding values of variate to obtain the third column containing fixi
Step 3 Find the sum of all entries in the third column to obtain $\sum f_i x_i$
Step 4 Find the sum of all the frequencies in the second column to obtain $\sum f_i$ or N
Step 5 Use the formula: x̄ = $\frac{\sum f_i x_i }{\sum f_i}$
Example 1
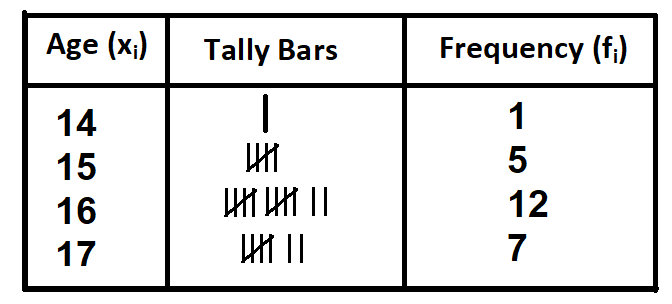
Given below are the ages of 25 students of a class in a school. Find the mean age of the students.
15,16,16,14,17,17,16,15,15,15,16,16,17,17,16,16,17,17,16,16,16,15,16,16,17
Solution
In order to find the mean, we must first prepare a frequency table for the given data
The given data can be presented in the tabular form as:
In order to compute the average age of students in the class, we prepare the following table:
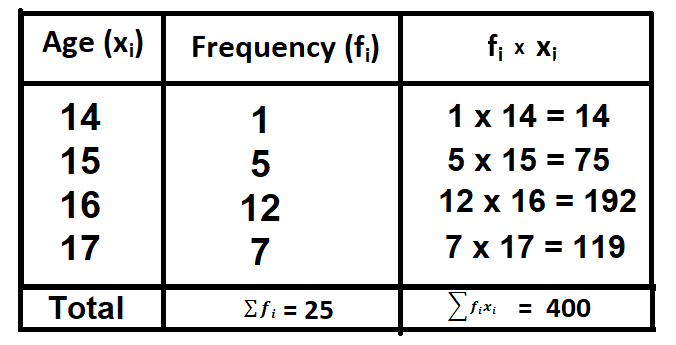
We have $\sum f_{i} = 25$ and $\sum f_{i}x_{i} = 400$
Therefore, Mean age =$\frac{\sum f_{i}x_{i} }{\sum f_{i}}=\frac{400}{25}= 16\,years$
Hence the mean of the 25 students is 16 years.
Example 2
The mean monthly wages of 10 members of a group is £1445. One more member whose monthly wage is £1500 has joined the group. Find the mean monthly wage of 11 members.
Solution
Here the number of values, n = 10
The given mean of these 10 values x̄ = 1445
We know that
Arithmetic Mean = $\frac{Sum\,of\,all\,observations}{Number\,of\,observations}$
This means that 1445 = $\frac{\sum x_{i} }{10}$
Hence,
$\sum x_{i}$ = 1445 x 10 = 14450
This means that the total monthly wages of 10 persons = £14450
The monthly wage of one more person who has joined the group is given as £1500
Therefore,
The total monthly wages of 11 persons = £14450 + £1500 = £15950
So, average monthly wages of 11 persons = $\frac{Sum\,of\,the\,monthly\,wages\,of\,11\,persons)}{Total\,number\,of\,persons}$
This means,
Average monthly wages of 11 persons = 15950/11 = £1450
Hence, the average monthly wage of 11 persons is £1450
Properties of Mean
- The sum of the deviations of individual observations from the mean (x̄) is zero. Symbolically,
If x1, x2, x3, ………. xn are the values of a variable and x̄ is their mean then
$\sum_{i=0}^{n}(x_{i} – \bar{x})= 0$
- If each observation in the data is replaced by mean (x̄) the total sum of all observations remain unaltered.
- If every value of the variable x is increased (or decreased ) by a constant value, the arithmetic mean of the observation so obtained also increases (or decreases) by the same constant.
- If the values of the variable x are multiplied ( or divided) by a constant the arithmetic mean of the new observations can be obtained by multiplying ( or dividing) the initial arithmetic mean by the same constant.
Median
Definition
The median of a group of observations is the value of the variable which divides the group into two equal parts. In other words, the median is the value that exceeds and is exceeded by the same number of observations, i.e. it is the value such that the number of observations above it is equal to the number of observations below it.
In simple terms, the median is the value that lies in the middle of the data with half of the observations above it and the other half below it.
Median of Ungrouped Data
In the case of individual observations, i.e. ungrouped data, the following are used to find the median.
Step 1: Arrange the observations in ascending or descending order or magnitude.
Step 2: Determine the total number of observations, say, n.
Step 3: If n is odd, then use the following formula:
Median = Value of $(\frac{n+1}{2})$th observation
If n is even, then use the following formula
Median = $\frac{Value\,of\,\frac{n}{2}th\,observation\,+\,Value\,of\,(\frac{n}{2}+1)th\,observation}{2}$
Let us understand both the scenarios with the help of examples
Example 1
Find the median of the data: 24, 36, 46, 17, 18, 25, 35
Solution
We will find the median using the above steps:
Step 1 Arrange the observations in ascending or descending order or magnitude.
Therefore, let us arrange the numbers in ascending order. We get:
17, 18, 24, 25, 35, 36, 46
Step 2 Determine the total number of observations, say, n.
Here the total number of observations n is 7, which is an odd number
Step 3 If n is odd, then use the following formula:
Median = Value of $(\frac{n+1}{2})^{th}$ observation
Hence, we find the value of $(\frac{n+1}{2})^{th}$ observation = (\frac{7+1}{2})^{th} observation = 4th observation
4th observation in the list is 25
Hence the median of the given set of observations is 25.
Example 2
Find the median of the data – 25, 34, 31, 23, 22, 26, 35, 28, 20, 32
Solution
We will find the median using the following steps:
Step 1 Arrange the observations in ascending or descending order or magnitude.
Therefore, let us arrange the numbers in ascending order. We get:
20, 22, 23, 25, 26, 28, 31, 32, 34, 35
Step 2 Determine the total number of observations, say, n.
Here the total number of observations n is 10, which is an even number
Step 3, If n is even, then use the following formula
Median = $\frac{Value\,of\,\frac{n}{2}th\,observation\,+\,Value\,of\,(\frac{n}{2}+1)th\,observation}{2}$
Now, the value of $\frac{n}{2}th$ = value of $\frac{10}{2}th$ observation = value of 5th observation = 26
and
Value of $(\frac{n}{2}+1)$th observation = value of $(\frac{10}{2}+1)$th observation= value of 6th observation = 28
Therefore, Median = $\frac{26+28}{2}$ = $\frac{54}{2}$ = 27
Hence, the median of the given observations = 27
Uses of Median
- Median is the only average that is used while dealing with qualitative data which cannot be measured quantitatively but still can be arranged in ascending or descending order of magnitude. For example, the median is used to find the average honesty, average intelligence, average beauty etc.
- Median is used for determining typical value in problems concerning wages distribution of wealth etc.
Properties of Median
- The median can be calculated graphically, while the mean cannot.
- The sum of the absolute deviations taken from the median is less than the sum of absolute deviations from any other observations in the data.
- The median is not much affected by extreme values and would therefore be a better representative as a centre or average.
Mode
Definition
Occasionally, when describing a set of data, the mode is used as a measure of central tendency. The mode is the most frequently occurring value in a data set. In other words, the mode is of distribution is the value at the point around which the items tend to most heavily concentrated. Thus mode or the modal value is the value in a series of observations that occurs with the highest frequency.
For instance, let the scores 10 students be
45, 40, 44, 44, 43, 38, 44, 35, 18, 38
Let us see which scores appears how many times in the List
| Score | Number of times it appears |
| 45 | 1 |
| 40 | 1 |
| 44 | 3 |
| 43 | 1 |
| 38 | 2 |
| 35 | 1 |
| 18 | 1 |
From the above table, we can see that the mode is 44 which occurs thrice and the other scores occur only once or twice.
Mode of Ungrouped Data
For ungrouped data, the mode can be located simply by inspecting the number of times each value appears in the set. Here the data can be arranged in an array and then count the frequencies of each variate. The variate having maximum frequency is the mode.
The followings steps are used to find out the mode of ungrouped data:
- Obtain the set of observations.
- Count the number of times the various values repeat themselves. In other words, prepare the frequency distribution table.
- Find the value which occurs the maximum number of times. This means that find the value which has the maximum frequency.
- The value obtained in the previous step is the mode.
Example
Find the mode of the data given below:
4, 6, 7, 8, 12, 11, 13, 9, 13, 9, 13, 9, 9, 7, 8
Solution
On observing the data, we can place the number of times each value appears as its frequency in the table below:
| Numbers | Frequency |
| 4 | 1 |
| 6 | 1 |
| 7 | 2 |
| 8 | 2 |
| 9 | 3 |
| 11 | 1 |
| 12 | 1 |
| 13 | 2 |
The above table clearly shows that the number 9 occurs 3 times which is the maximum among all frequencies.
Hence, the mode for the given data set is 9.
Uses of Mode
Mode is the average to be used to find the ideal size. For example, it is extensively used in business forecasting, in the manufacturing of clothes, in the manufacturing of shoes etc.
Properties of Mode
- Mode, like median, can be calculated graphically.
- Mode is not affected by extreme values.
- The mode can be used for open-ended distribution and qualitative data.
Some More Examples on Mean, Median and Mode
Example 1
The following number of goals were scored by a team in a series of 10 matches:
2, 3, 4, 5, 0, 1, 3, 3, 4, 3
Find the mean, median and mode of these scores.
Solution
Let us first calculate the mean of the given data.
Here, the observations in this case are – 2, 3, 4, 5, 0, 1, 3, 3, 4 and 3
Total number of observations = 10
We know that to calculate the mean first we need to find the sum of all the observations.
Therefore,
(2 + 3 + 4 + 5 + 0 +1 + 3 + 3 + 4 +3) = 28
Now, according to the formula of the mean,
Arithmetic Mean = $\frac{Sum\, of\, all\, observations}{Number\, of\, observations}$
Therefore,
Arithmetic Mean = 28/10 = 2.8
Hence, the mean of the given data is 2.8
Now, let us calculate the median of the data
To calculate the median, we will first arrange the observations in ascending or descending order or magnitude.
We get,
0, 1, 2, 3, 3, 3, 3, 4, 4, 5
Now, we determine the total number of observations, say, n. Here the total number of observations n is 10, which is an even number.
If n is even, then we use the following formula
Median = $\frac{Value\,of\,\frac{n}{2}th\,observation\,+\,Value\,of\,(\frac{n}{2}+1)th\,observation}{2}$
Now, the value of $\frac{n}{2}$ th observation = value of $\frac{10}{2}$ th observation = value of 5th observation = 3
and
Value of $(\frac{n}{2}+1)$ th observation = value of $(\frac{10}{2}+1)$ th observation = value of 6th observation = 3
Therefore, Median = $\frac{3+3}{2}$ = $\frac{6}{2}$ = 3
Hence, median of the given observations = 3
Last, we calculate the mode of the given data. We know that observation with the maximum frequency is called the mode.
On observing the data, we can place the number of times each value appears as its frequency in the table below:
| Number | Frequency |
| 0 | 1 |
| 1 | 1 |
| 2 | 1 |
| 3 | 4 |
| 4 | 2 |
| 5 | 1 |
The above table clearly shows that the number 3 occurs 4 times which is the maximum among all frequencies.
Hence, the mode for the given data set is 3
Relation between Mean, Median and Mode
Mean, median and mode are correlated by the following formula –
Mode = 3 Median – 2 Mean
Example
If the ratio of mode and median of a certain data is 6: 5, then find the ratio of its mean and median.
Solution
We know that the Empirical formula defining the relation between mean, median and mode is
Mode = 3 Median – 2 Mean
We have been given that the ratio of mode and median of a certain data is 6: 5.
This ratio can also be written as
$\frac{Mode}{Median} = \frac{6}{5}$
Or
Mode = $\frac{6\times Median}{5}$
Now, we replace this value of mode in the empirical formula.
We get
$\frac{6\times Median}{5}$ = 3 Median – 2 Mean
⇒ 6 x Median = 5 ( 3 Median – 2 Mean)
⇒ 6 x Median = 15 Median – 10 Mean
⇒ 10 Mean = 15 Median – 6 Median
⇒ 10 Mean = 9 Median
We are required to find the ratio of mean and median. Hence we will write the above equation as:
$\frac{Mean}{Median} = \frac{9}{10}$
Or Mean : Median = 9 : 10
Hence, we can say that if the ratio of mode and median of a certain data is 6: 5, then the ratio of its mean and median will be 9:10.
Recommended Worksheets
Solving Measures of Variability 6th Grade Math Worksheets
Measures of Variability (Basketball Themed) Worksheets
Solving Measures of Central Tendency 6th Grade Math Worksheets