Introduction
We consider both numerical and categorical variables when analyzing data. While categorical variables are divided into nominal and ordinal data, numerical variables are categorized as continuous and discrete data.
We shall discuss the definition, characteristics, collection, and analysis processes, as well as several nominal data samples, in this article.
Nominal data, commonly referred to as nominal scale, is a type of data used in statistics to name variables without providing any numerical values. It is a scale of measure in its most basic form.
Nominal data are “labeled” or “named” data that may be categorized into different, non-overlapping groups. In this instance, data is simply divided into several categories; it is neither measured nor evaluated. These groups are distinctive and lack any shared components. Since the order of the data collected cannot be determined using nominal data, changing the order will not change the meaning of the data.
What is nominal data?
Definition
Nominal data, commonly referred to as nominal scale, is a type of data that is used in statistics to name variables without providing any numeric value. Data that may be labeled or categorized into groups that cannot coexist is known as nominal data. No logical arrangement of these categories is possible. Its scale of measurement is in its most basic form.
Some examples of nominal data include gender, blood type, hair color, eye color, marital status, modes of transportation, etc.
What are the characteristics of nominal data?
Nominal data is the 1st level among the levels of measurement and is considered the most basic form. The following are the characteristics of nominal data:
( a ) Nominal data cannot ever be quantified and will always take the form of nomenclature. Labels used to classify nominal data are solely descriptive; they don’t have any quantitative or numerical value. The data acquired cannot be added, subtracted, multiplied, or otherwise analyzed statistically, logically, or numerically in this situation, making it impossible to draw the conclusion that one variable is stronger than the other variable.
( b ) On a nominal scale, a variable is divided into two or more categories. The response to a particular question can fall into either group at this level of measurement. The categories are mutually exclusive. Say, for example, that a person cannot have both an A- and an O+ blood type.
( c ) Nominal data can never be given a specific order or hierarchy, in contrast to ordinal data. For instance, it is impossible to order factors like blood type, eye color, and marital status from greatest to worst.
( d ) Answer choices are almost certainly going to be qualitative in nature, so collected data will always include a qualitative component. Qualitative qualities are those that can be observed but typically cannot be quantified through a numerical outcome.
( e ) The mode is the central tendency that may be quantified using nominal data. The variable that appeared the most frequently in the data set is the mode.
Examples: Nominal Data
Nominal data primarily focus on describing qualities. The table below shows some examples of nominal data.
| Gender | Male, Female |
| Blood Type | A- , A+, B-, B+, AB-, AB+, O-, O+ |
| Hair Color | Black, Blonde, Brown, Grey, etc. |
| Eye Color | Amber, Black, Blue, Gray, Brown, Green, etc. |
| Marital Status | Single, Married, Widowed, Divorced, Separated |
| Nationality | British, American, German, Mexican, etc. |
| Favorite Subject | Math, Science, English, etc. |
| Favorite Sports | Basketball, Volleyball, Soccer, Badminton, Swimming, etc. |
| Mode of Transportation | Bus, train, bicycle, etc. |
Collection of Nominal Data
Nominal data can be collected through the following questions:
( a ) closed-ended questions
( b ) open-ended questions
( c ) multiple response questions
Let us discuss how these questions are applied to collecting nominal data.
Closed-ended questions
Use closed-ended questions if there are just a few labels that can include all the data for the variable you are interested in. The respondents may be asked to choose from a list of possibilities in the case of closed-ended questions, where the answers are already known.
The questions listed below are examples of closed-ended questions:
( a ) What is your gender?
- Male
- Female
( b ) What is your favorite subject?
- Mathematics
- English
- Science
- Social Studies
- Physical Education
( c ) Do you own a cellphone?
- Yes
- No
( d ) Do you own a laptop?
- Yes
- No
( e ) Do you own a desktop?
- Yes
- No
Open-ended questions
Use open-ended questions if your variable of interest has a wide range of possible labels for which you cannot produce a comprehensive list. A question that is open-ended does not have a clear “yes” or “no” answer or a predetermined response. To encourage a more extended response, open-ended inquiries are framed as statements.
The following are examples of open-ended questions:
( a ) What is your mobile number?
( b ) What is your nationality?
( c ) What is your zip code?
( d ) What is your student number?
( e ) What is your name?
Using open-ended questions, the respondent has the option to answer the question without any limitations. A text box typically follows open-ended questions. Limitations may be placed on the text box, such as those relating to word or character length, input format, language, etc. These limitations act more as a checklist for replying appropriately than a limit on the respondent’s response.
Let us take the scenario where the open-ended question is, “What is your student ID number?” Letters cannot be entered in the text box; only numbers are permitted. With the constraint, this open-ended question makes it easier for respondents to provide the correct response.
Multiple Response Choice Questions
This method allows for several responses to a question. It considers the possibility that respondents could occasionally fit into more than one classification category. Checkboxes are typically used to achieve this strategy that instructs the respondents to select an item.
Nevertheless, there are also instances where respondents are given limitations, such as “you can only select up to 2 items.” The respondents can only check two options in this manner. Choosing the option that pertains to your choice is one of the prompts used in the questionnaire.
The following are examples of multiple response questions:
( a ) Which of the following pizza toppings do you like? (You may choose three toppings)
- Anchovies
- Pepperoni
- Mushrooms
- Bacon
- Sausage
- Bell Pepper
- Pineapple
- Tomato
- Ham
( b ) Which social media account do you own? (Select all that apply)
- You Tube
- Tik Tok
- Tumblr
- Flickr
- Snapchat
Multiple response questions focus on the user. The strenuous task of typing responses is not required since options are provided already. Multiple response questions help in the gathering of pertinent research data. However, respondents are not given the freedom to express themselves completely. It limits possible solutions to a predetermined set of options.
How are Nominal Data Analyzed?
The grouping method can be used to evaluate nominal data. The variables can be divided into groups, and the frequency or percentage can be determined for each category.
You can arrange your data in tables and charts and then use those representations to study nominal data. You can then compile some descriptive statistics for your data collection. These support your efforts to analyze your data’s frequency distribution and identify its central tendency. However, not every measure of central tendency or variability may be used with nominal data.
Mathematical operators cannot handle nominal data but can still be examined using sophisticated statistical techniques. Nonparametric tests like the chi-squared test can be used for nominal data in hypothesis testing. The chi-squared test is used to detect whether there is a substantial discrepancy between the frequency of the provided values as expected and as observed.
Frequency Distribution Table
We compile the results of the analysis of Nominal data into a frequency distribution table that lists the categories and their counts. In other words, the table provides the answers and how frequently each appears in the data set.
Bar Chart
A bar chart is mostly used to analyze nominal data. It graphically depicts each response’s frequency as a bar rising vertically from the horizontal axis. A bar chart or bar graph uses rectangular bars with heights or lengths proportional to the values they represent to show categorical data.
Pie Chart
Analyzing nominal data with a pie chart is another method. In a set of nominal data, it is used to depict the percentage frequency of each item.
Pie charts and bar charts are both used to analyze nominal data, although their applications vary based on the component being taken into account. The researcher typically uses a pie chart to visualize percentages, while a bar chart is typically used to visualize the distribution frequency.
Example
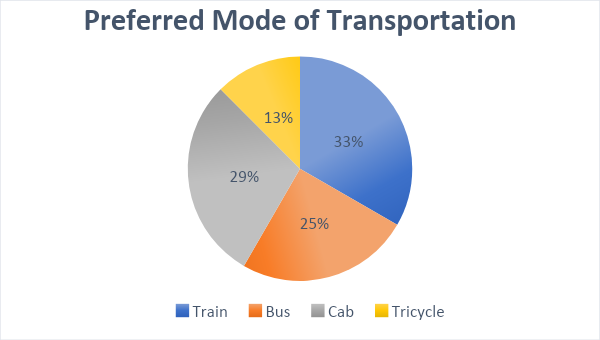
For instance, a researcher gathered the raw data below regarding the respondents’ preferred mode of public transportation. Use a frequency distribution table and pie chart to visualize the data.
| Bus | Train | Train | Cab | Train | Tricycle | Bus | Cab | Cab | Train |
| Bus | Train | Train | Cab | Train | Tricycle | Bus | Cab | Cab | Train |
| Bus | Train | Train | Cab | Train | Tricycle | Bus | Cab | Cab | Train |
| Bus | Train | Train | Cab | Train | Tricycle | Bus | Cab | Cab | Train |
| Bus | Train | Train | Cab | Train | Tricycle | Bus | Cab | Cab | Train |
| Bus | Train | Tricycle | Cab | Train | Tricycle | Bus | Cab | Train | Train |
| Bus | Train | Tricycle | Cab | Train | Tricycle | Bus | Cab | Train | Train |
| Bus | Train | Tricycle | Cab | Train | Tricycle | Bus | Cab | Train | Train |
| Bus | Train | Tricycle | Cab | Train | Tricycle | Bus | Cab | Train | Train |
| Bus | Train | Tricycle | Cab | Train | Tricycle | Bus | Cab | Train | Train |
| Cab | Cab | Cab | Cab | Cab | Cab | Cab | Cab | Cab | Cab |
| Bus | Bus | Bus | Bus | Bus | Bus | Bus | Bus | Bus | Bus |
Frequency Distribution Table
| Modes of Public Transportation | Frequency | Percentage |
| Bus | 20 | 25% |
| Cab | 25 | 29.17% |
| Train | 40 | 33.33% |
| Tricycle | 15 | 12.50% |
| Total | 100 | 100% |
According to the frequency distribution table, 20 respondents, or 25%, preferred buses as their preferred mode of transportation, followed by 25 respondents, or 29.17%, who chose cabs, 40 respondents, or 33.33%, who chose trains, and 15 respondents, or 12.50%, who chose tricycles.
Pie Chart
Summary
Definition
Nominal data, commonly referred to as nominal scale, is a type of data that is used in statistics to name variables without providing any numeric value. Data that may be labeled or categorized into groups that cannot coexist is known as nominal data. No logical arrangement of these categories is possible. Its scale of measurement is in its most basic form.
Characteristics of Nominal Data
( a ) Nominal data cannot ever be quantified and will always take the form of nomenclature.
( b ) On a nominal scale, a variable is divided into two or more categories.
( c ) Nominal data can never be given a specific order or hierarchy, in contrast to ordinal data.
( d ) Answer choices are almost certainly going to be qualitative in nature, so collected data will always include a qualitative component.
( e ) The mode is the central tendency that may be quantified using nominal data.
Collection of Nominal Data
Nominal data can be collected through the following questions:
( a ) closed-ended questions
( b ) open-ended questions
( c ) multiple response questions
Frequently Asked Questions on Nominal Data (FAQs)
How to visualize nominal data?
Pie charts and bar graphs are two visual representations of nominal data. To display nominal data, frequency and percentage distribution tables can be employed.
Frequency Distribution Table
We compile the results of the analysis of Nominal data into a frequency distribution table that lists the categories and their counts. In other words, the table provides the answers and how frequently each appears in the data set.
Bar Chart
A bar chart is mostly used to analyze nominal data. It graphically depicts each response’s frequency as a bar rising vertically from the horizontal axis. A bar chart or bar graph uses rectangular bars with heights or lengths proportional to the values they represent to show categorical data.
Pie Chart
Analyzing nominal data with a pie chart is another method. In a set of nominal data, it is used to depict the percentage frequency of each item.
Pie charts and bar charts are both used to analyze nominal data, although their applications vary based on the component being taken into account. The researcher typically uses a pie chart to visualize percentages, while a bar chart is typically used to visualize the frequency of the distribution.
How are nominal data collected?
Nominal data can be collected through the following questions:
( a ) closed-ended questions
( b ) open-ended questions
( c ) multiple response questions
Closed-ended questions
Use closed-ended questions if there are just a few labels that can include all the data for the variable you are interested in. The respondents may be asked to choose from a list of possibilities in the case of closed-ended questions, where the answers are already known.
Open-ended questions
Use open-ended questions if your variable of interest has a wide range of possible labels for which you cannot produce a comprehensive list. A question that is open-ended is one that does not have a clear “yes” or “no” answer or a predetermined response. To encourage a more extended response, open-ended inquiries are framed as statements.
Using open-ended questions, the respondent has the option to answer the question without any limitations. A text box typically follows open-ended questions. Limitations may be placed on the text box, such as those relating to word or character length, input format, language, etc. These limitations act more as a checklist for replying appropriately than as a limit on the respondent’s response.
Multiple Response Choice Questions
This method allows for several responses to a question. It considers the possibility that respondents could occasionally fit into more than one classification category. Checkboxes are typically used to achieve this strategy that instructs the respondents to select an item.
What are the characteristics of nominal data?
Nominal data, commonly referred to as nominal scale, is a type of data that is used in statistics to name variables without providing any numeric value. Data that may be labeled or categorized into groups that cannot coexist is known as nominal data. No logical arrangement of these categories is possible. Its scale of measurement is in its most basic form.
The following are the characteristics of nominal data:
( a ) Nominal data cannot ever be quantified and will always take the form of nomenclature.
( b ) On a nominal scale, a variable is divided into two or more categories.
( c ) Nominal data can never be given a specific order or hierarchy, in contrast to ordinal data.
( d ) Answer choices are almost certainly going to be qualitative in nature, so collected data will always include a qualitative component.
( e ) The mode is the central tendency that may be quantified using nominal data.
What central tendency measure can be computed using nominal data?
The mode is the central tendency that may be quantified using nominal data. The variable that showed up most frequently is shown by the central tendency
measure known as the mode.
The mean and median of nominal data cannot be determined.
How do nominal and ordinal data differ from one another?
Nominal and ordinal data are two different types of data that can be categorized in statistics.
Nominal data, commonly referred to as nominal scale, is a type of data that is used in statistics to name variables without providing any numeric value. Data that may be labeled or categorized into groups that cannot coexist is known as nominal data. No logical arrangement of these categories is possible. Its scale of measurement is in its most basic form.
Ordinal data is categorized into groups with a natural rank order within a variable. The separations between the categories, however, are inconsistent or unknowable.
What are the benefits and limitations of using nominal data?
The following are some of the advantages of nominal data:
( a ) It is possible to get a lot of responses to questions fast. Surveys are a quick way to collect minimal data, especially if you employ a digital system that can automatically classify data.
( b ) As it only depends on the respondents’ selection of replies, it has more excellent reliability. Nominal data typically has a high level of reliability because it is straight out of a survey or other data collection method and promptly categorized.
( c ) Respondents are given the opportunity to share their opinions openly. When there are close-ended questions, it is much easier to conduct the research.
( d ) It doesn’t take much time, and anyone with a basic level of experience can do it. Additionally, it is less expensive because simply a questionnaire and a set of questions are required.
Nominal data has the following disadvantages, to name a few:
( a ) Nominal data cannot be quantified because it can only be measured qualitatively and not numerically.
( b ) Nominal data cannot typically be ordered, which may be a drawback for some research endeavors.
( c ) Out of all the data types, nominal data has the lowest level of measurement because variables can only be given names.
What are some examples of nominal data?
Nominal data primarily focus on describing qualities. The table below shows some examples of nominal data.
| Gender | Male, Female |
| Blood Type | A- , A+, B-, B+, AB-, AB+, O-, O+ |
| Hair Color | Black, Blonde, Brown, Grey, etc. |
| Eye Color | Amber, Black, Blue, Gray, Brown, Green, etc. |
| Marital Status | Single, Married, Widowed, Divorced, Separated |
| Nationality | British, American, German, Mexican, etc. |
| Favorite Subject | Math, Science, English, Social Studies, etc. |
| Favorite Sports | Basketball, Volleyball, Soccer, Badminton, Swimming, etc. |
| Mode of Transportation | Bus, train, bicycle, etc. |
| Genre | Classical, Jazz, Hip-hop, Rock, etc. |
| Pets | Dogs, Cats, Fish, Birds, Hamsters, etc. |
| Language | English, French, German, Spanish, etc. |
| Religious Affiliation | Christianity, Islam, Hinduism, Buddhism, Judaism, etc. |
| House Style | Colonial House, Victorian House, Tudor House, Cottage House, Mediterranean House, Ranch-Style House |
Recommended Worksheets
Data (World War II Themed) Math Worksheets
Nominal and Ordinal Data (Winter Solstice Themed) Math Worksheets
Discrete and Continuous Data (Spring Equinox Themed) Math Worksheets