Download Measures of Variability (Basketball Themed) Worksheets
Click the button below to get instant access to these premium worksheets for use in the classroom or at a home.
This worksheet can be edited by Premium members using the free Google Slides online software. Click the Edit button above to get started.
Download free sample
Not ready to purchase a subscription yet? Click here to download a FREE sample of this worksheet pack.
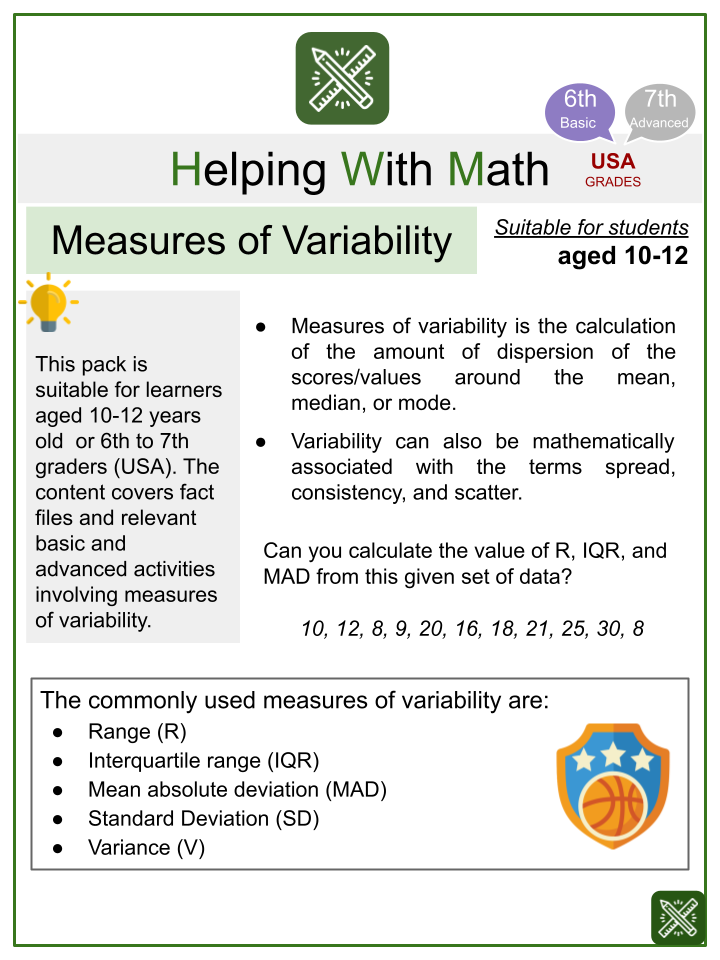
Definition
Measures of variability is the calculation of the amount of dispersion of the scores/values around the mean, median, or mode.
Variability can also be mathematically associated with the terms spread, consistency, and scatter.
Summary
The commonly used measures of variability are:
- Range (R)
- Interquartile range (IQR)
- Mean absolute deviation (MAD)
- Standard Deviation (SD)
- Variance (V)
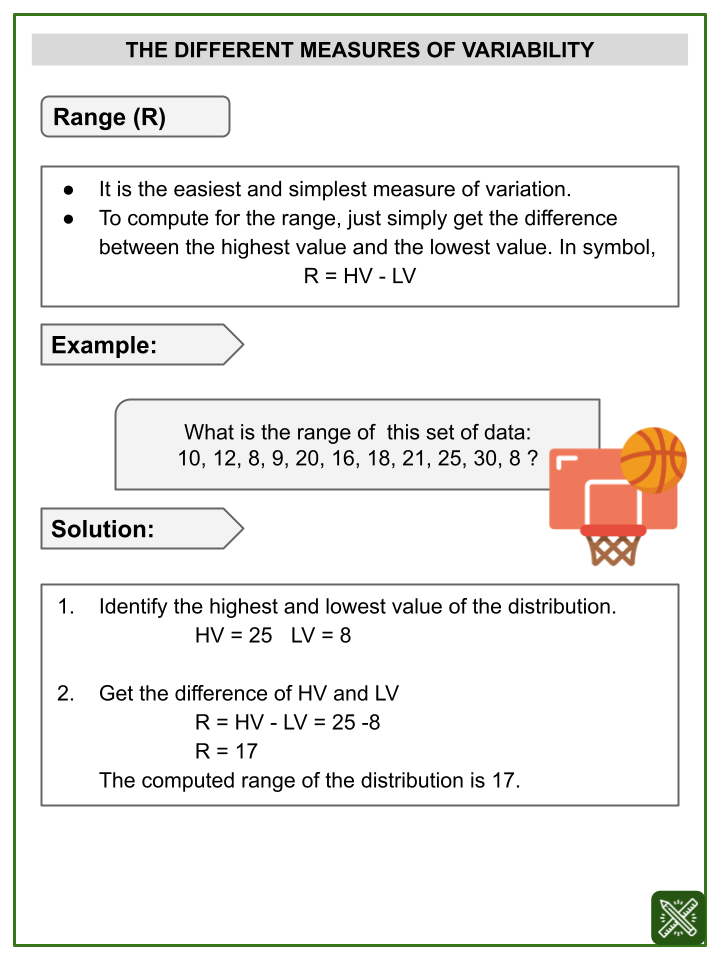
THE DIFFERENT MEASURES OF VARIABILITY
Range (R)
- It is the easiest and simplest measure of variation.
- To compute for the range, just simply get the difference between the highest value and the lowest value. In symbol,
R = HV – LV
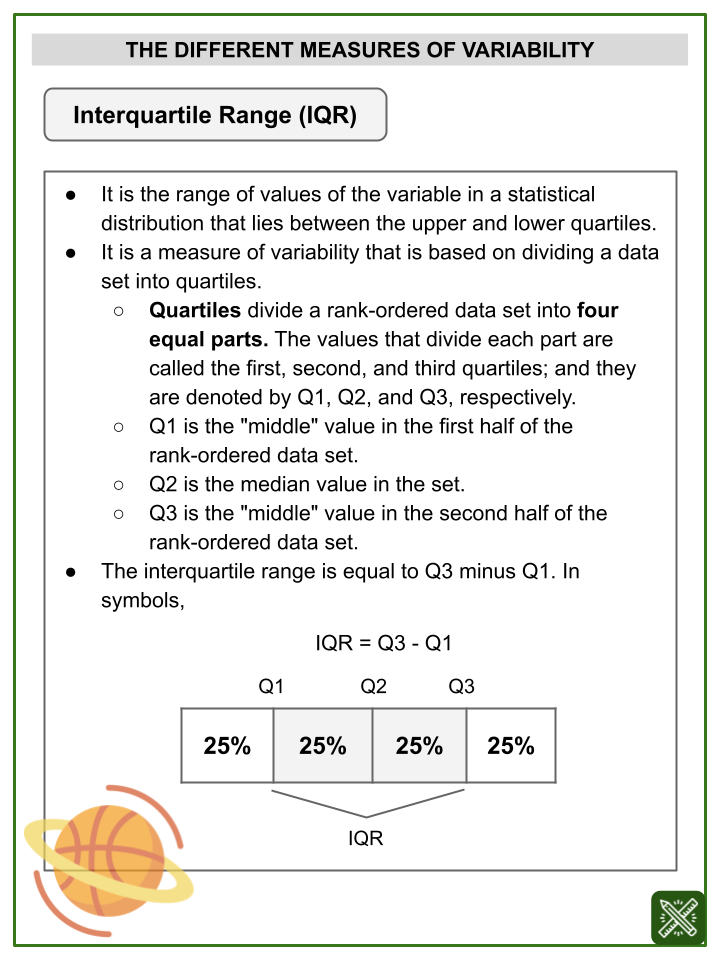
Interquartile Range (IQR)
- It is the range of values of the variable in a statistical distribution that lies between the upper and lower quartiles.
- It is a measure of variability that is based on dividing a data set into quartiles.
- Quartiles divide a rank-ordered data set into four equal parts. The values that divide each part are called the first, second, and third quartiles; and they are denoted by Q1, Q2, and Q3, respectively.
- Q1 is the “middle” value in the first half of the rank-ordered data set.
- Q2 is the median value in the set.
- Q3 is the “middle” value in the second half of the rank-ordered data set.
- The interquartile range is equal to Q3 minus Q1. In symbols,
- IQR = Q3 – Q1
Mean Absolute Deviation (MAD)
- It is the average distance of all scores/values away from the mean.
- It determines how scatter/spread out the values in a given set of data are.
Measures of Variability (Basketball Themed) Worksheets
This is a fantastic bundle which includes everything you need to know about Measures of Variability across 21 in-depth pages.
Each ready to use worksheet collection includes 10 activities and an answer guide. Not teaching common core standards? Don’t worry! All our worksheets are completely editable so can be tailored for your curriculum and target audience.
Resource Examples
Click any of the example images below to view a larger version.
Worksheets Activities Included
Ages 10-11 (Basic)
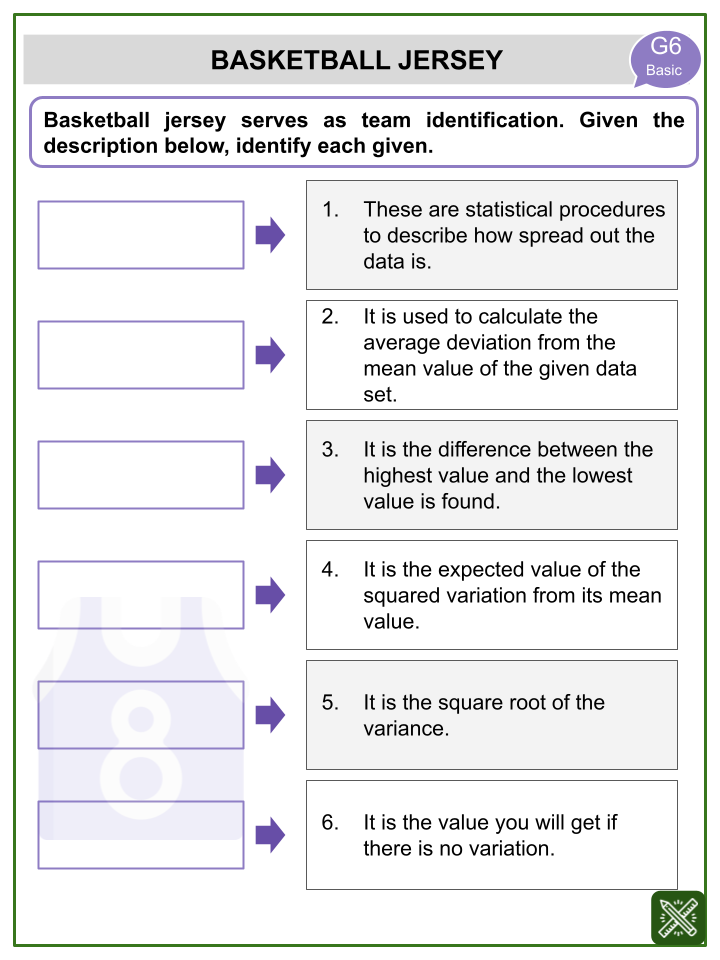
- Basketball Jersey
- Basketball Sprint
- Larry’s Homework
- Superstars’ Range
- Basketball Bucks
Ages 11-12 (Advanced)
- Turnovers Per Game
- Milwaukee Bucks Game
- Lebron James’ Stat
- NBA Finals Scenario
- Stat and Basketballs