Download Making Statistical Inferences Using Measures of Central Tendency and Variability Worksheets
Click the button below to get instant access to these premium worksheets for use in the classroom or at a home.
This worksheet can be edited by Premium members using the free Google Slides online software. Click the Edit button above to get started.
Download free sample
Not ready to purchase a subscription yet? Click here to download a FREE sample of this worksheet pack.
Definition:
A measure of central tendency is a quantitative representation of the data under exploration or investigation. A measure of variability is a summarized statistic that represents the amount of dispersion in a date set.
Summary:
Measure of Central Tendency is also called as Measure of Average. It is a statistic that serves as a representative of a certain data. On the other hand, a Measure of Variability is also called as Measure of Dispersion. It is a statistics that defines the spread of the values in a certain data set.
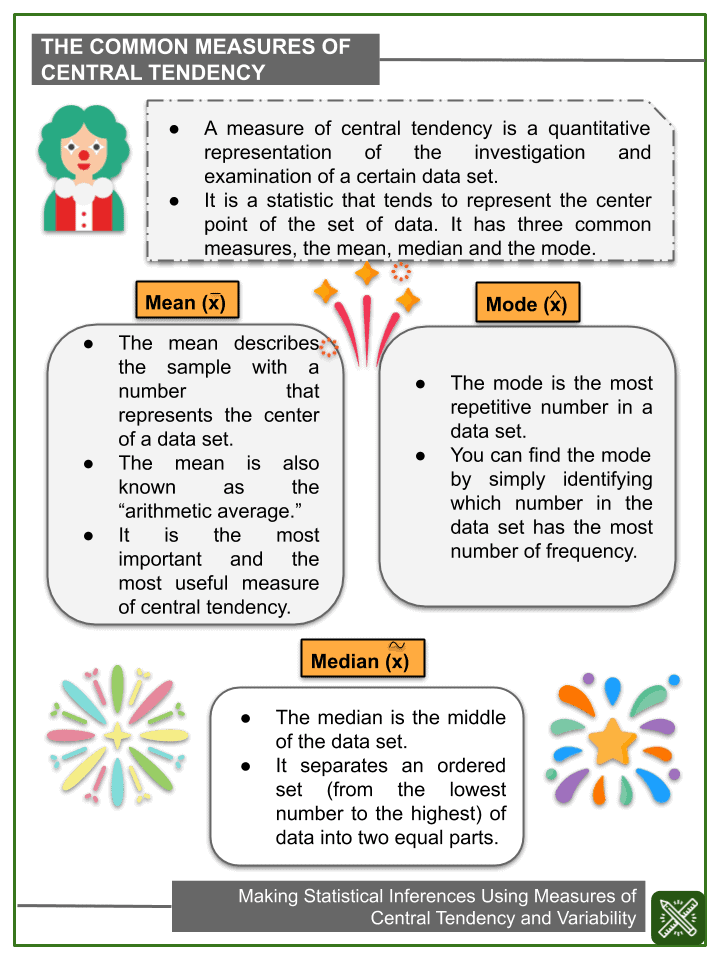
A measure of central tendency is a quantitative representation of the investigation and examination of a certain data set.
It is a statistic that tends to represent the center point of the set of data. It has three common measures, the mean, median and the mode.
Mean:
- The mean describes the sample with a number that represents the center of a data set.
- The mean is also known as the “arithmetic average.”
- It is the most important and the most useful measure of central tendency.
Mode:
- The mode is the most repetitive number in a data set.
- You can find the mode by simply identifying which number in the data set has the most number of frequency.
Median:
- The median is the middle of the data set.
- It separates an ordered set (from the lowest number to the highest) of data into two equal parts.
Making Statistical Inferences Using Measures of Central Tendency and Variability Worksheets
This is a fantastic bundle which includes everything you need to know about Making Statistical Inferences Using Measures of Central Tendency and Variability across 15+ in-depth pages. These are ready-to-use Common core aligned Grade 7 Math worksheets.
Each ready to use worksheet collection includes 10 activities and an answer guide. Not teaching common core standards? Don’t worry! All our worksheets are completely editable so can be tailored for your curriculum and target audience.
Resource Examples
Click any of the example images below to view a larger version.