Download Measures of Central Tendency (Academy Themed) Worksheets
Click the button below to get instant access to these premium worksheets for use in the classroom or at a home.
This worksheet can be edited by Premium members using the free Google Slides online software. Click the Edit button above to get started.
Download free sample
Not ready to purchase a subscription yet? Click here to download a FREE sample of this worksheet pack.
Definition
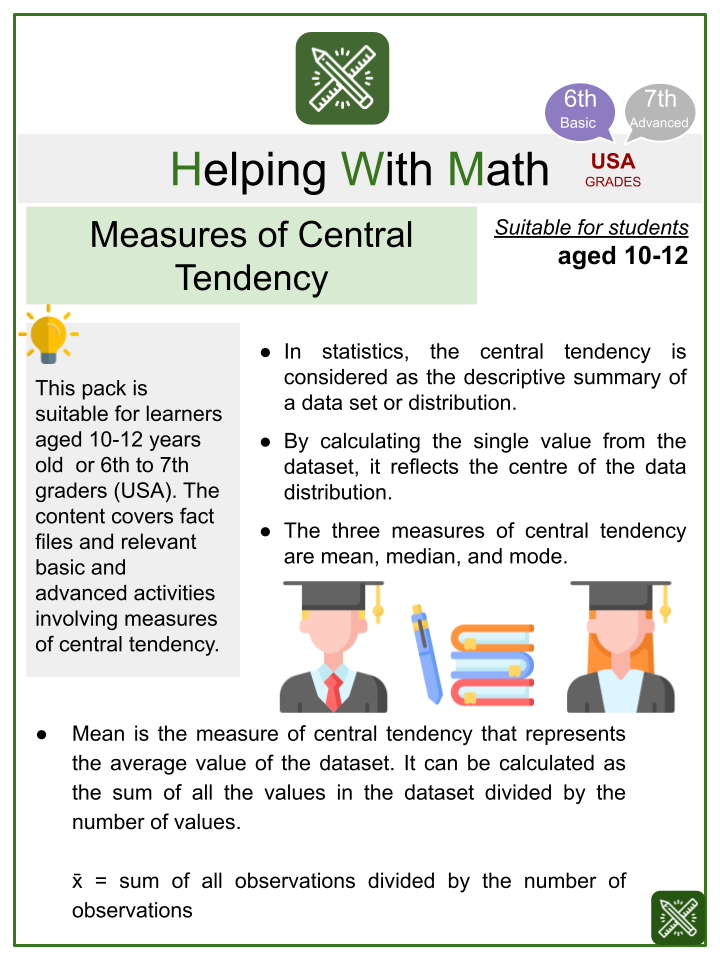
- In statistics, the central tendency is considered as the descriptive summary of a data set or distribution.
- By calculating the single value from the dataset, it reflects the centre of the data distribution.
- The three measures of central tendency are mean, median, and mode.
Summary
- Mean is the measure of central tendency that represents the average value of the dataset. It can be calculated as the sum of all the values in the dataset divided by the number of values.
x̄ = sum of all observations divided by the number of observations
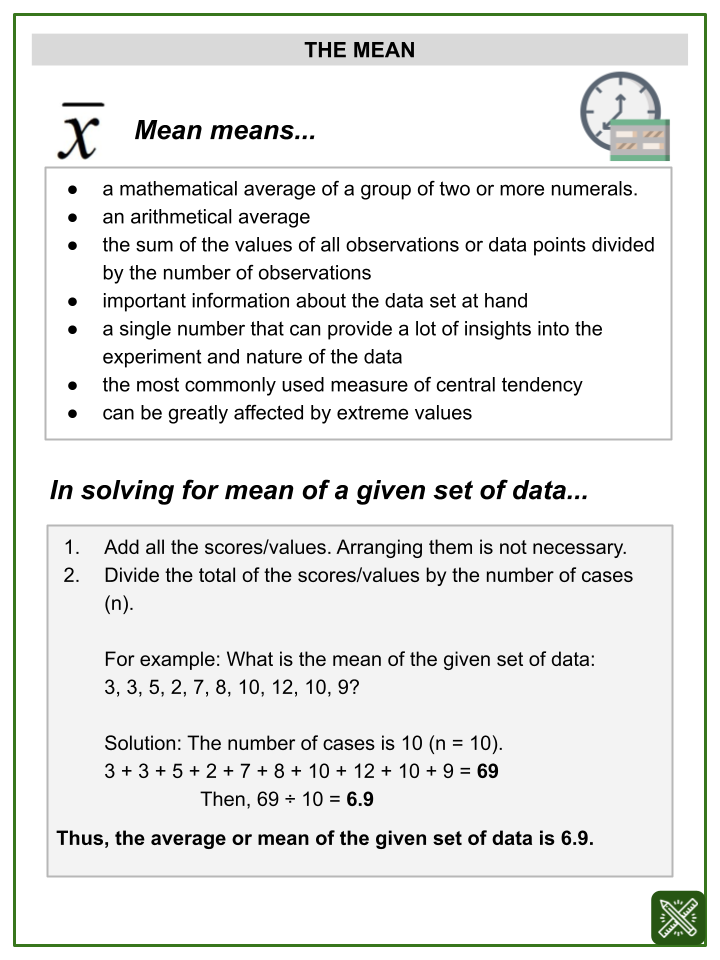
Mean means…
- a mathematical average of a group of two or more numerals.
- an arithmetical average
- the sum of the values of all observations or data points divided by the number of observations
- important information about the data set at hand
- a single number that can provide a lot of insights into the experiment and nature of the data
- the most commonly used measure of central tendency
- can be greatly affected by extreme values
In solving for mean of a given set of data…
- Add all the scores/values. Arranging them is not necessary.
- Divide the total of the scores/values by the number of cases (n).
For example: What is the mean of the given set of data:
3, 3, 5, 2, 7, 8, 10, 12, 10, 9?
Solution: The number of cases is 10 (n = 10).
3 + 3 + 5 + 2 + 7 + 8 + 10 + 12 + 10 + 9 = 69
Then, 69 ÷ 10 = 6.9
Thus, the average or mean of the given set of data is 6.9.
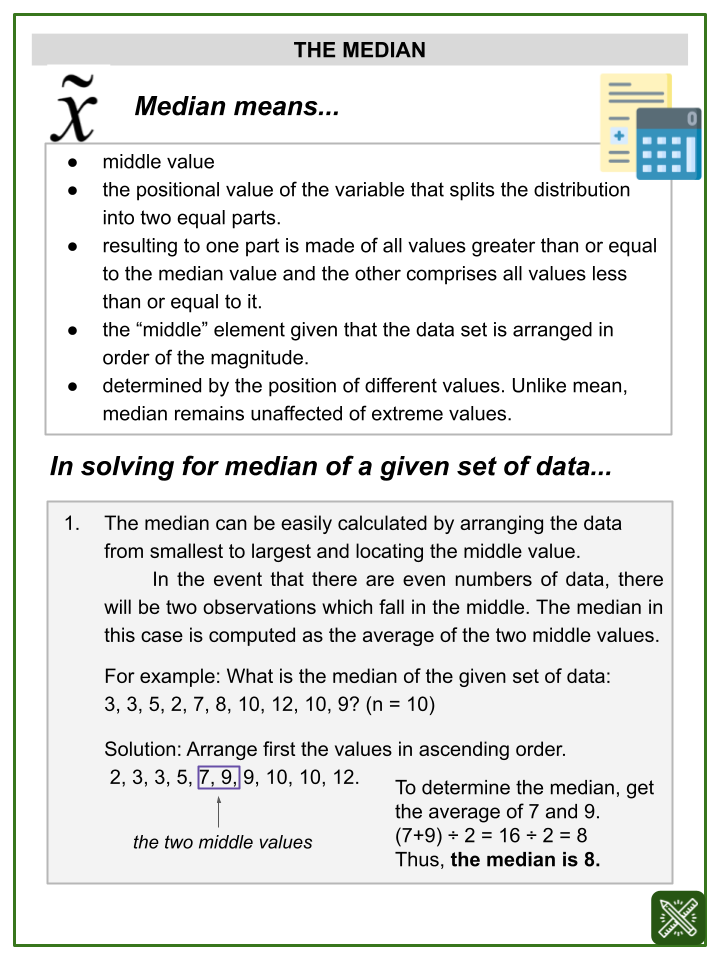
Median means…
- middle value
- the positional value of the variable that splits the distribution into two equal parts.
- resulting to one part is made of all values greater than or equal to the median value and the other comprises all values less than or equal to it.
- the “middle” element given that the data set is arranged in order of the magnitude.
- determined by the position of different values. Unlike mean, median remains unaffected of extreme values.
In solving for median of a given set of data…
- The median can be easily calculated by arranging the data from smallest to largest and locating the middle value.
In the event that there are even numbers of data, there will be two observations which fall in the middle. The median in this case is computed as the average of the two middle values.
For example: What is the median of the given set of data:
3, 3, 5, 2, 7, 8, 10, 12, 10, 9? (n = 10)
Solution: Arrange first the values in ascending order.
2, 3, 3, 5, 7, 9, 9, 10, 10, 12.
To determine the median, get the average of 7 and 9.
(7+9) ÷ 2 = 16 ÷ 2 = 8Thus, the median is 8.
Mode means…
- most typical value of a given set of data
- the value around which maximum concentration of items occurs
- “la Mode” in French which can be translated as the most fashionable values of a distribution, because it is repeated the highest number of times in the series.
- the most frequently observed data value.
- A data is said to be unimodal if it has one mode only.
- A data is said to be bimodal if it has two values of mode.
- A data is multimodal if it has more than two values of mode.
In solving for mode of a given set of data…
- To solve for mode, just pick the number with the most number of occurence. Unlike median, arranging the values is unnecessary.
For example: What is the mode of the given set of data:
3, 3, 5, 2, 7, 8, 10, 12, 10, 9? (n = 10)
Solution: 3 and 10 occurred twice. Thus the values of mode in this given set of data is 3 and 10. The distribution is bimodal.
Measures of Central Tendency (Academy Themed) Worksheets
This is a fantastic bundle which includes everything you need to know about Measures of Central Tendency across 21 in-depth pages.
Each ready to use worksheet collection includes 10 activities and an answer guide. Not teaching common core standards? Don’t worry! All our worksheets are completely editable so can be tailored for your curriculum and target audience.
Resource Examples
Click any of the example images below to view a larger version.
Worksheets Activities Included
Ages 10-11 (Basic)
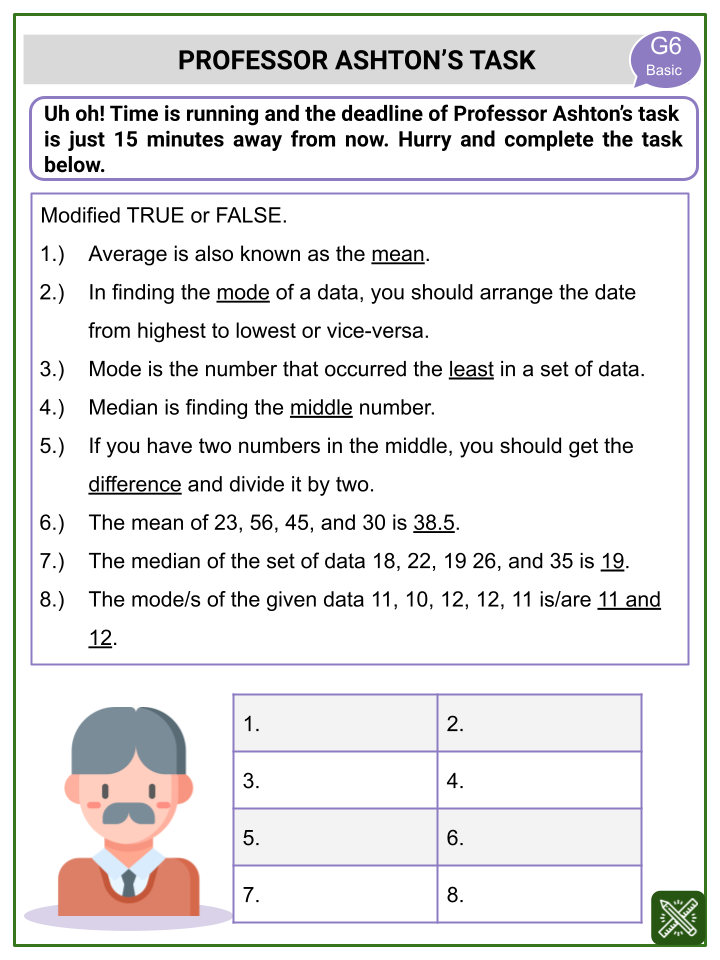
- Professor Ashton’s Task
- Mrs. Smith’s Dilemma
- 50-50 Quiz
- The Most Frequent Score
- Diagnostic Test
Ages 11-12 (Advanced)
- Some Days in the Academy
- Students’ Ranks
- Mode All the Way
- What Do You Mean?
- Enhancing Your Reasoning Skills