Download Scaling Picture Graph and Bar Graph Worksheets
Click the button below to get instant access to these premium worksheets for use in the classroom or at a home.
This worksheet can be edited by Premium members using the free Google Slides online software. Click the Edit button above to get started.
Download free sample
Not ready to purchase a subscription yet? Click here to download a FREE sample of this worksheet pack.
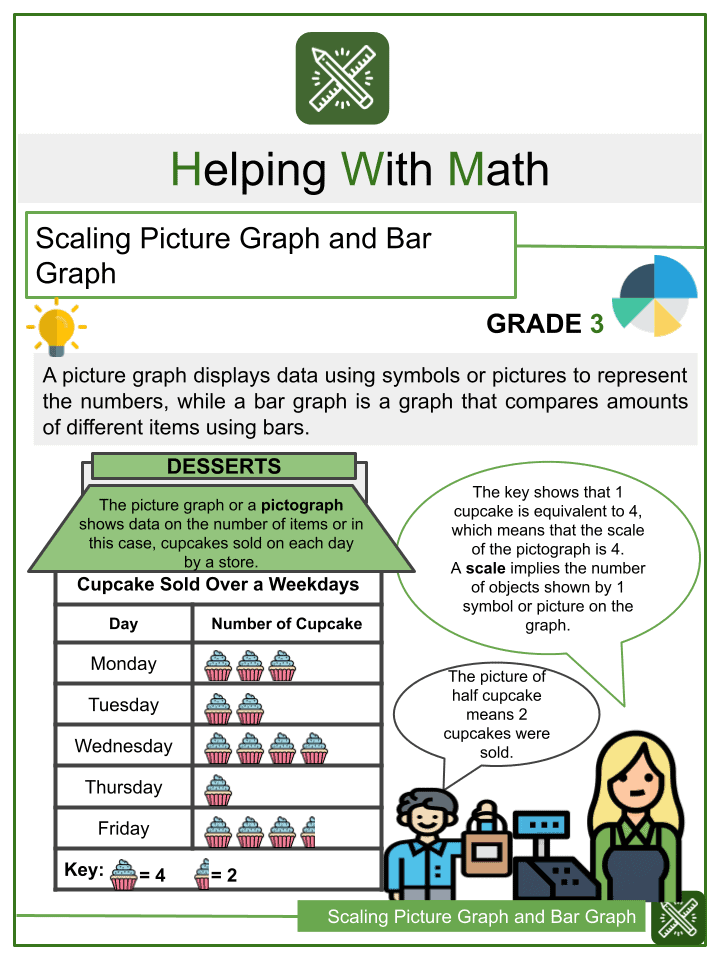
Definition:
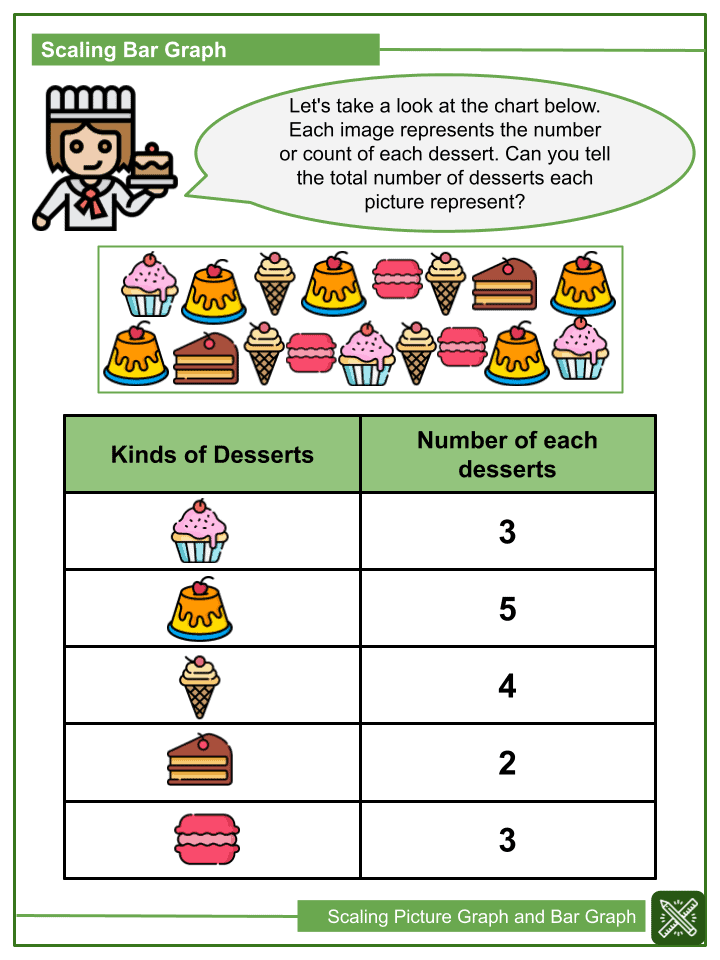
A picture graph displays data using symbols or pictures to represent the numbers, while a bar graph is a graph that compares amounts of different items using bars.
Summary:
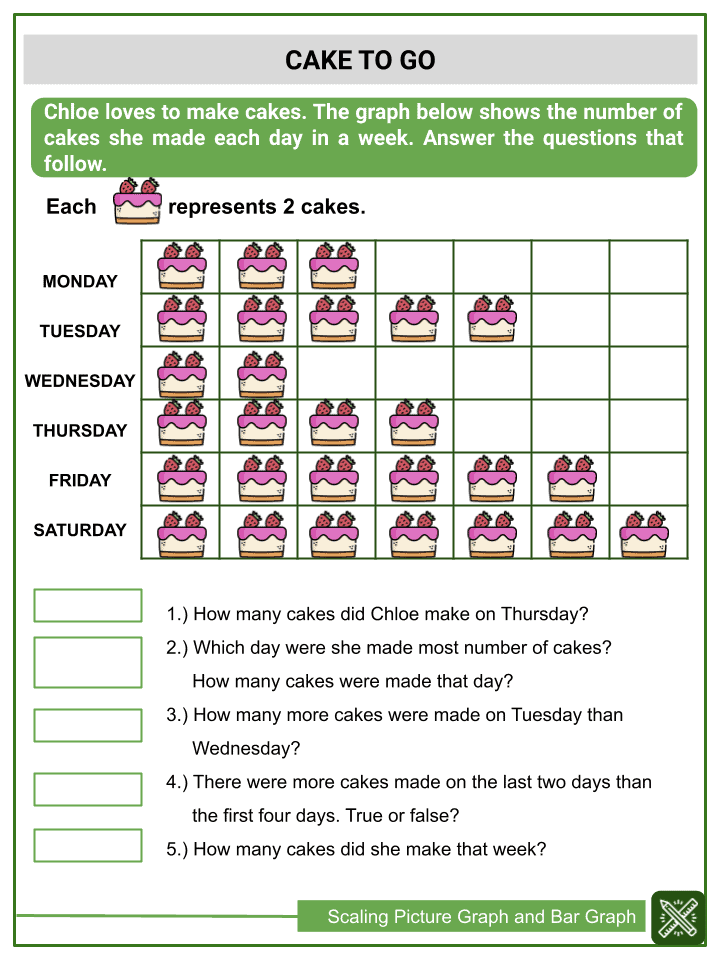
The picture graph or a pictograph shows data on the number of items or in this case, cupcakes sold on each day by a store.
Fun Facts:
- A picture graph is also known as a pictograph or pictogram.
- The discovery of picture graphs dates back to before 3000 BC in Egypt and Mesopotamia.
- The word pictograph originates from the words ‘pict’ (Latin: painted) and ‘graph’ (English: diagram).
Fun Facts:
- The bars of a bar graph can be represented both vertically and horizontally.
Scaling Picture Graph and Bar Graph Worksheets
This is a fantastic bundle which includes everything you need to know about Scaling Picture Graph and Bar Graph across 15+ in-depth pages. These are ready-to-use Common core aligned Grade 3 Math worksheets.
Each ready to use worksheet collection includes 10 activities and an answer guide. Not teaching common core standards? Don’t worry! All our worksheets are completely editable so can be tailored for your curriculum and target audience.
Resource Examples
Click any of the example images below to view a larger version.