Download Solving Measures of Central Tendency Worksheets
Click the button below to get instant access to these premium worksheets for use in the classroom or at a home.
This worksheet can be edited by Premium members using the free Google Slides online software. Click the Edit button above to get started.
Download free sample
Not ready to purchase a subscription yet? Click here to download a FREE sample of this worksheet pack.
Definition:
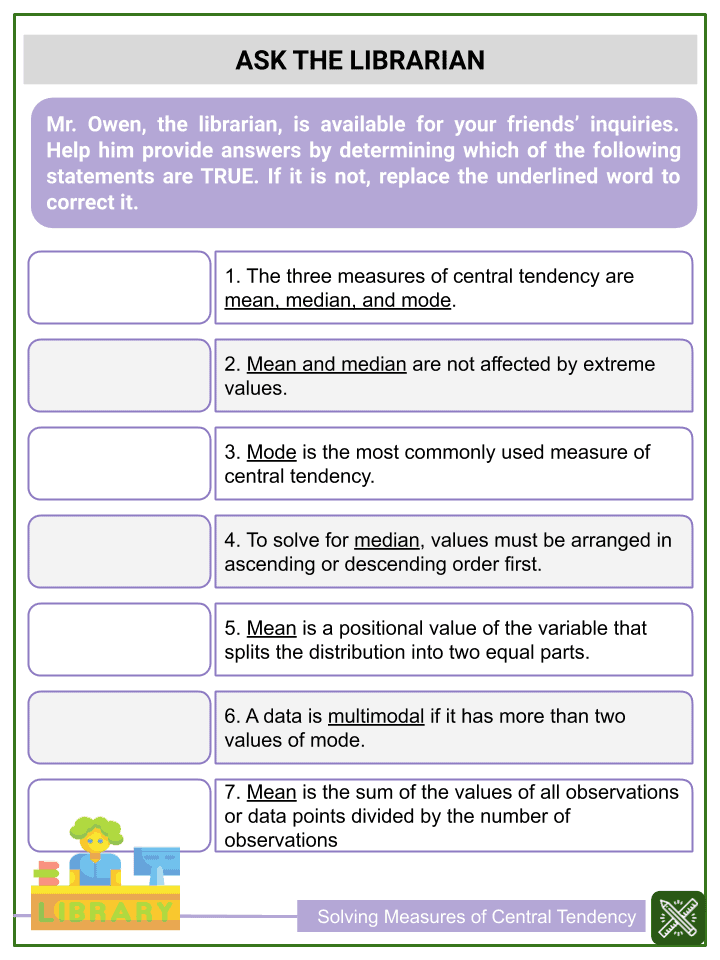
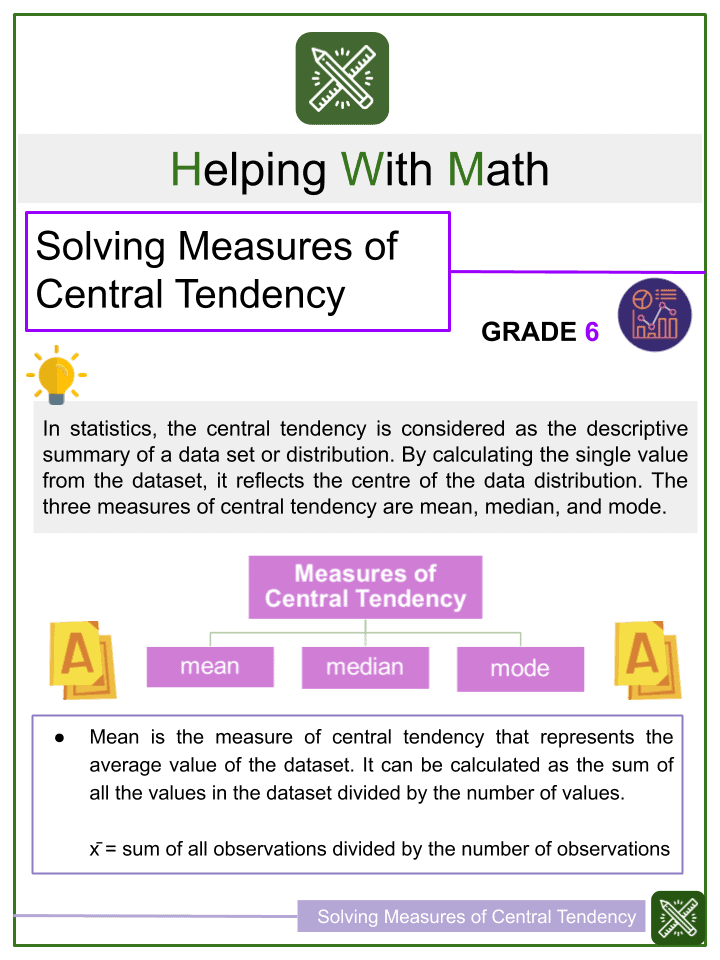
In statistics, the central tendency is considered as the descriptive summary of a data set or distribution. By calculating the single value from the dataset, it reflects the centre of the data distribution. The three measures of central tendency are mean, median, and mode.
Summary:
Measures of Central Tendency:
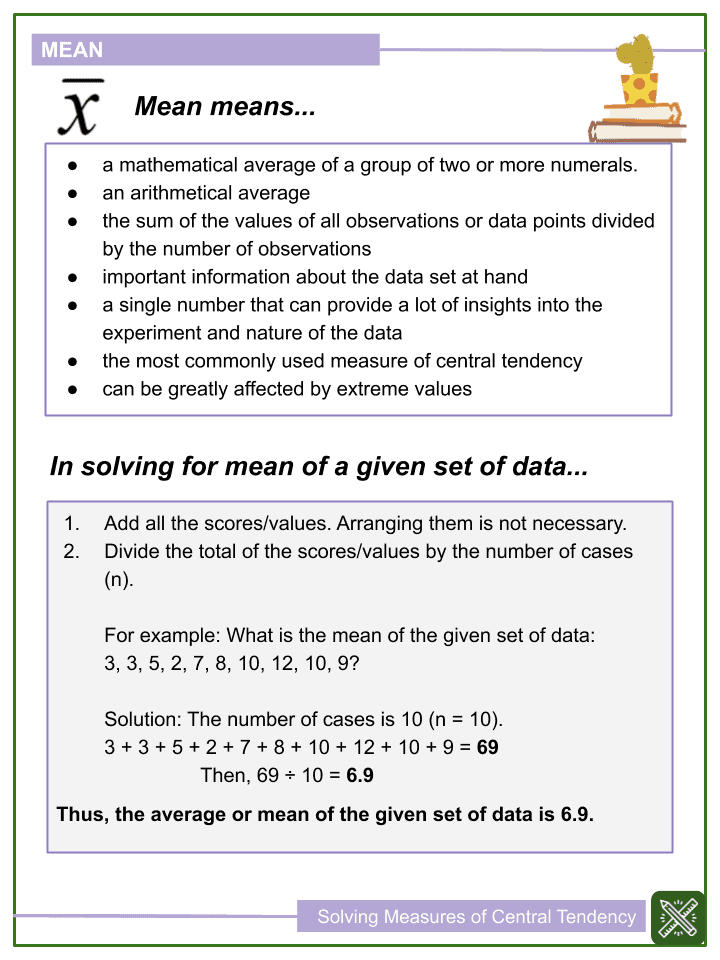
1. Mean
- a mathematical average of a group of two or more numerals.
- an arithmetical average
- the sum of the values of all observations or data points divided by the number of observations
- important information about the data set at hand
- a single number that can provide a lot of insights into the experiment and nature of the data
- the most commonly used measure of central tendency
- can be greatly affected by extreme values
- x̄ = sum of all observations divided by the number of observations
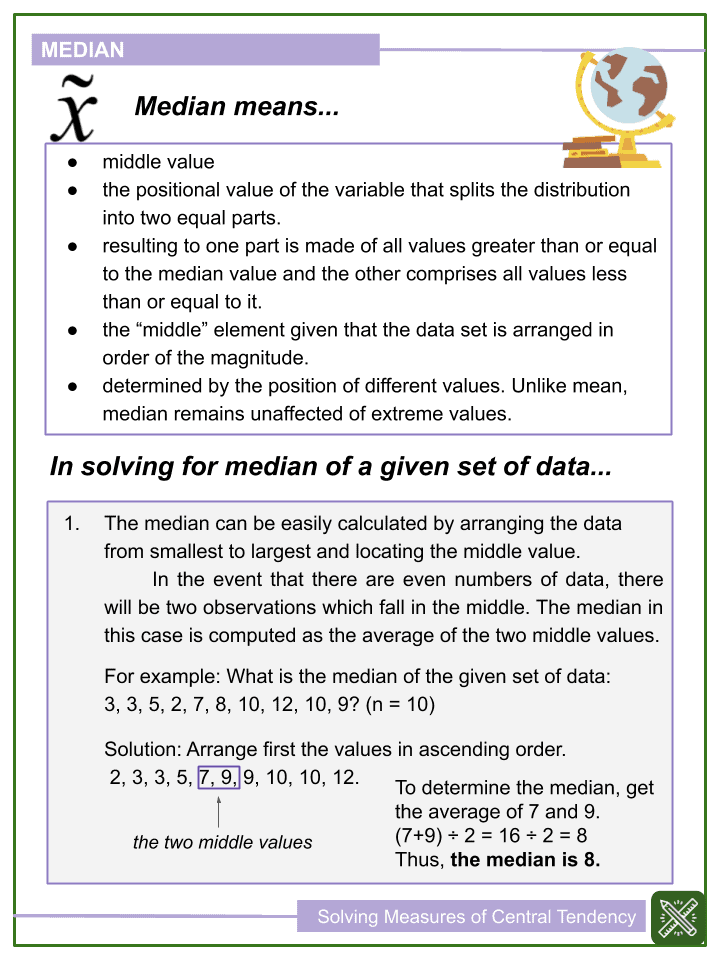
2. Median
- middle value
- the positional value of the variable that splits the distribution into two equal parts.
- resulting to one part is made of all values greater than or equal to the median value and the other comprises all values less than or equal to it.
- the “middle” element given that the data set is arranged in order of the magnitude.
- determined by the position of different values. Unlike mean, median remains unaffected of extreme values.
3. Mode
- most typical value of a given set of data
- the value around which maximum concentration of items occurs
- “la Mode” in French which can be translated as the most fashionable values of a distribution, because it is repeated the highest number of times in the series.
- the most frequently observed data value.
- A data is said to be unimodal if it has one mode only.
- A data is said to be bimodal if it has two values of mode.
- A data is multimodal if it has more than two values of mode.
Resource Examples
Click any of the example images below to view a larger version.