Students typically begin their formal study of Statistics and Probability in 6th Grade. The resources on this section of HelpingWithMath.com will help you to help your children with their work on statistics and probability.
What you will find in the Statistics & Probability section.
The following have been added to this section so far:
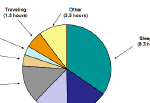
- Pie Charts
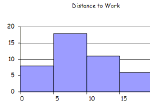
- Histograms
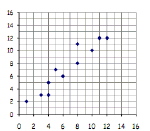
- Scatter Plots
- Mean, Median, & Mode
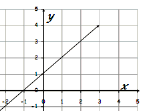
- Rate of Change
- Probability
- Statistics & Probability Worksheets
These sections are summarized below.
These sections are summarized below.
 | What is a Pie Chart? explains what pie charts are and how they show a slice of a circle to represent what fraction a given amount is of the whole. There are step-by-step instructions showing how to calculate the angles for each slice. |
| The brief lesson, What is a Histogram?, shows how data can be represented as a series of equal width bars on a histogram. |  |
 | Scatter Plots are introduced in this lesson. Examples illustrate how these Scatter Plots can show positive or negative correlations. Additionally, examples show how such correlations can be strong or weak. |
| Mean, Median, and Mode are explained as being measures of central tendency. Examples show how each of these can calculated or found. |  |
 | The Rate of Change, or slope of line are briefly illustrated and discussed. Includes an example on how walking speed can be compared based on the slope of a graph of distance against time. |
| There is an introduction to what probability is. Examples show how theoretical, experimental, and complementary probabilities are calculated for different sets of data.Formal study of Probability typically starts in 7th Grade. |  |